
Weekly Market Outlook – Technically Overextended, But Also Room to Run

The brief pause in the bigger-picture rally from a couple weeks back ended up not meaning much. Stocks rekindled the rally last week, logging gains that were healthy even if not explosive. The S&P 500 advanced to the tune of 0.5%, while the NASDAQ Composite added 1.5% to its value.
And yet, with those moves, both indexes are now toying with -- and perhaps stalling at -- noteworthy technical lines.
We’ll look at this action in a moment below. First, let’s work through last week’s top economic reports (there were several!) and then preview what little bit is in the lineup for this week.
Economic Data Analysis
Busy week! The party started on Tuesday with a look at last month’s consumer inflation data. It was up, as expected, marking the second month in a row it ticked higher. It’s not exactly alarming yet, but things could get that way soon enough. The interesting part is that Wednesday’s producer inflation data doesn’t show the same price increases. These numbers are still reasonably near the Federal Reserve’s bigger-picture target.
Consumer, Producer Inflation Charts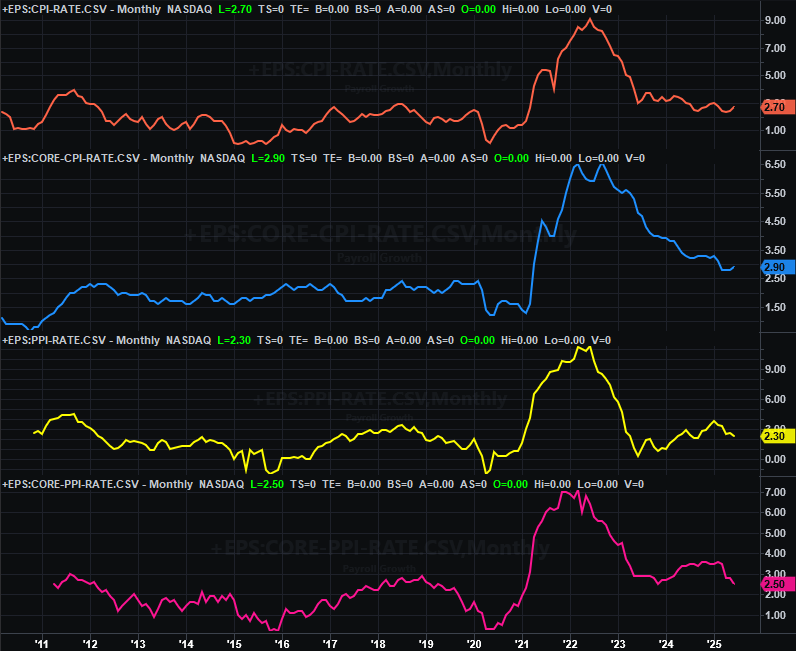
Source: Bureau of Labor Statistics, TradeStation
This of course leaves the FOMC in a tricky spot. There’s not actually room or reason to cut interest rates now. Fortunately traders aren’t expecting a cut later this month, when the Fed’s got a scheduled chance to do so. But, the 50/50 chance of a cut to the Fed Funds Rate in September is now in question. Be sure to keep close tabs in future inflation reports, as well as the consumer income and spending numbers.
Also on Wednesday we heard June’s capacity utilization and industrial production report. Both were up, and more a bit more than expected.
Industrial Production, Capacity Utilization Charts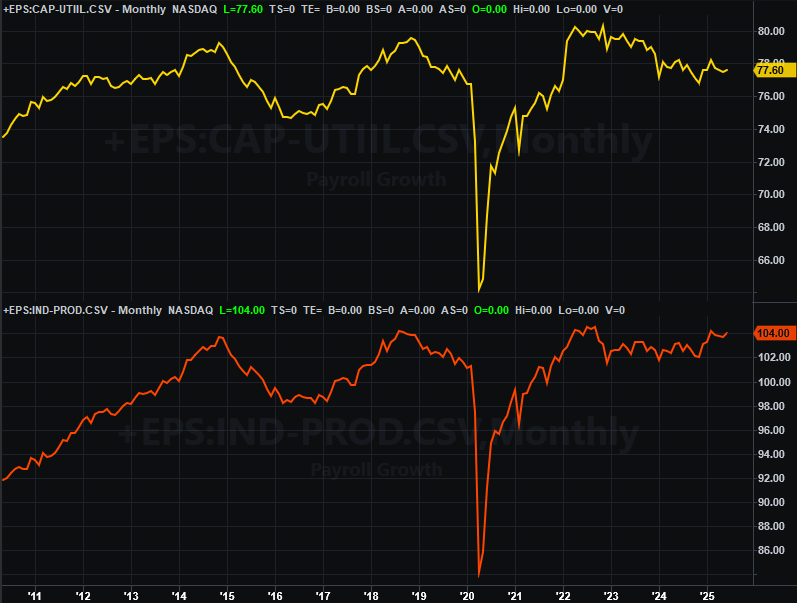
Source: Federal Reserve, TradeStation
We didn’t desperately need an improvement here, and it’s not like this shallow progress is game-changing. But, this is certainly bullishly encouraging.
On Thursday we got last month’s retail sales report. You may recall May’s numbers were a bit troubling, echoing lulls seen off an on all year. This spending perked up a bit in June though, extending shallow bigger-picture uptrends. Not thrilling, but again, encouraging.
Retail Sales Charts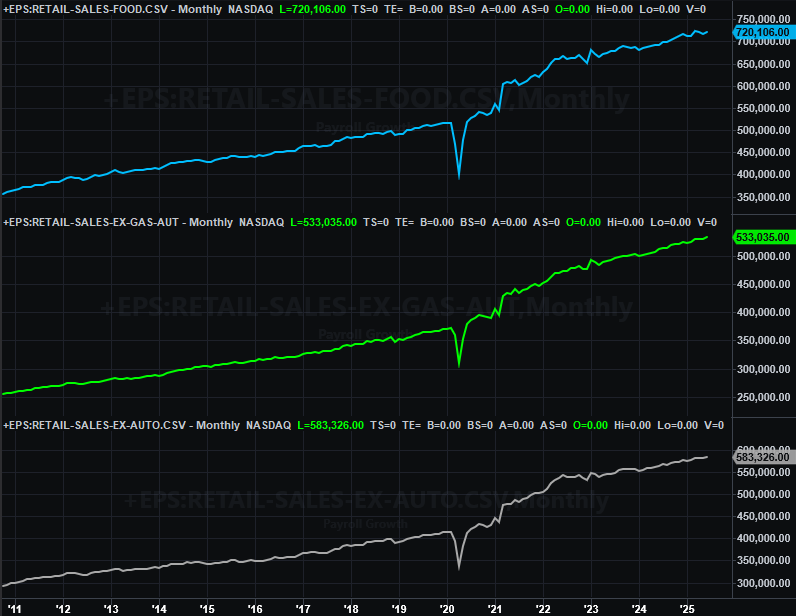
Source: Federal Reserve, TradeStation
Finally, on Friday we kicked off what will be a couple weeks’ worth of real estate data, beginning with June’s housing starts and building permits. Like so much else, they ticked up (as expected), albeit only barely. Both data sets remain in bigger-picture downtrends.
Housing Starts, Building Permits Charts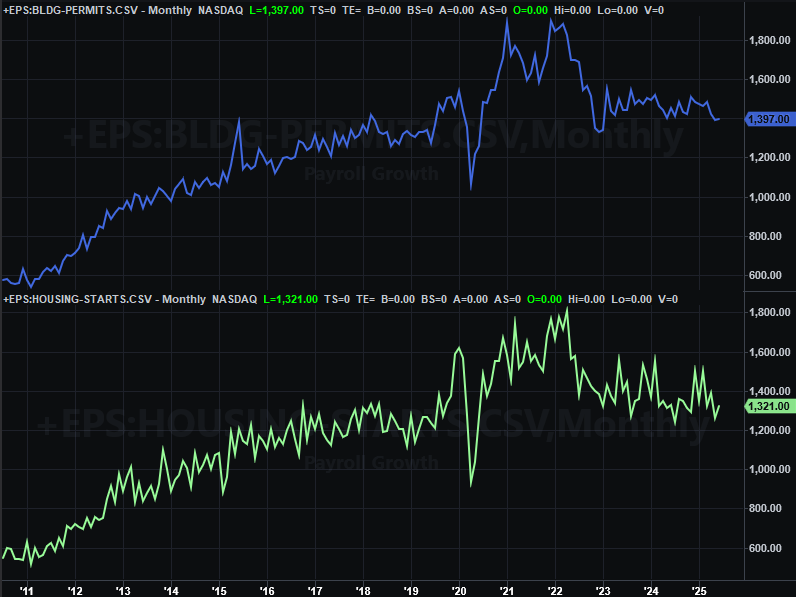
Source: Federal Reserve, TradeStation
It’s likely the rest of the real estate data due through the end of this month will also be lackluster. Just don’t panic. It’s increasingly looking like the industry’s brewing weakness is limited to the industry itself, probably as part of a major price correction.
Everything else is on the grid.
Economic Data Report Calendar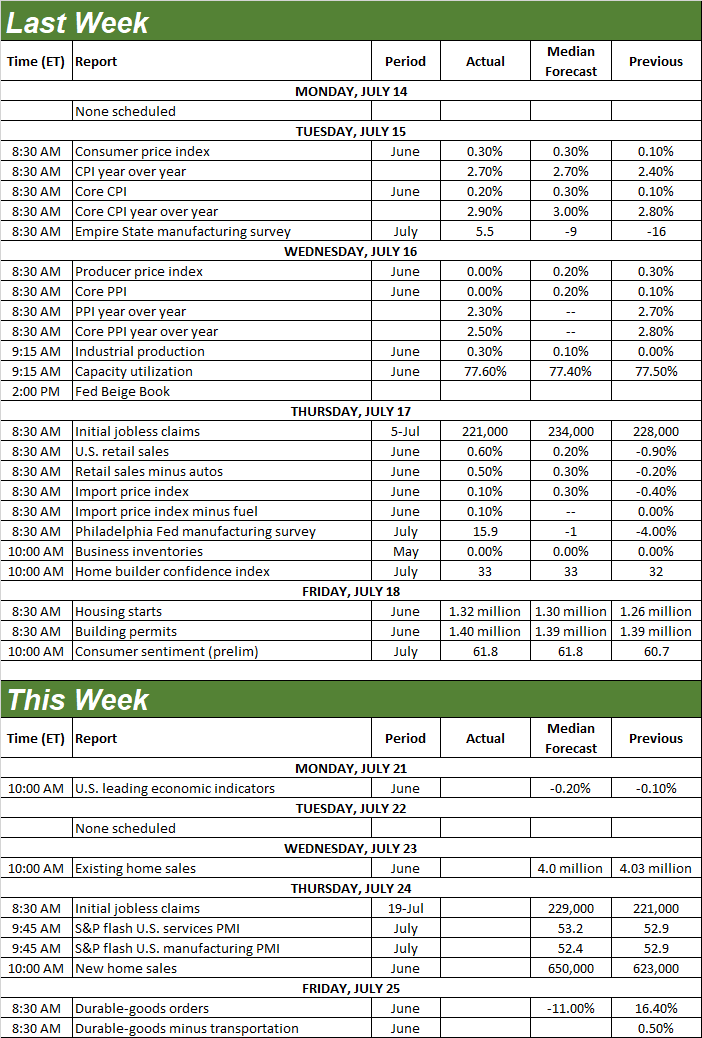
Source: Briefing.com, TradeStation
This week is going to be pretty tame, with only one double-barreled set of real estate numbers on tap. June’s sales of existing homes will be released on Wednesday, with new-home sales numbers coming on Thursday. Existing home sales are likely to be more or less in line with May’s still-weak results, while sales of new homes are expected to perk up just a bit from May’s also-lackluster count.
New, Existing Home Sales Charts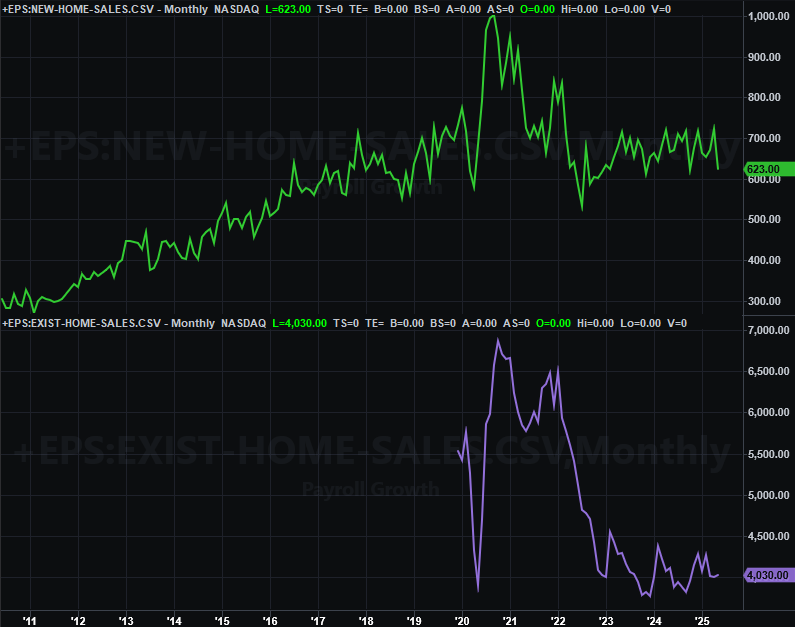
Source: Census Bureau, National Assn. of Realtors, TradeStation
Yes, this remains evidence of the real estate market’s tepidness. Again though, it seems to not be felt or sensed anywhere else. In this vein, the University of Michigan’s sentiment data released on Friday (not shown here) showed a slight bit of improvement, with clear confidence that inflationary pressures aren’t going to be as bad as feared a few months back when tariff-mania was in full swing.
Stock Market Index Analysis
We’re actually going to start this week’s analysis out with a look at the weekly chart of the S&P 500, since it makes the most sense to paint the bigger brushstrokes first. As you can see, the index edged a little higher after last week’s stall, working its way (albeit barely) to a new record.
S&P 500 Weekly Chart, with VIX 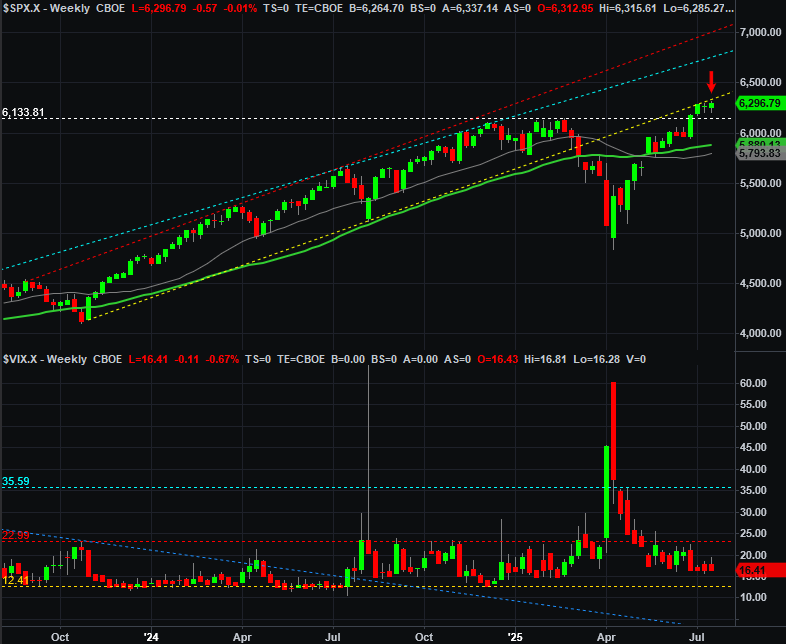
Source: TradeNavigator
There is a curious development here, however. See the yellow, dashed line that now appears to be preventing the index from moving any higher any faster? That line used to be the lower boundary of the rising channel that framed the bull market going all the way back to 2023’s big dip.
Old support lines don’t always necessarily become new technical ceilings. But, in that this one has dropped the hint three weeks in a row now, it’s too big to ignore.
The weekly chart also of course illustrates just how far the S&P 500 has come just since early April. Thanks to last week’s 0.5% advance, the index is now up 30% from its April low. Regardless of the backdrop and circumstances, that’s just a lot of ground to cover in short period of time, setting the stage for some profit-taking pressure.
The funny thing is, the NASDAQ Composite isn’t facing the same trouble. It’s now squarely back in the middle of the rising trading range from the prior two years, only now bumping into a secondary support level that connects a couple of minor lows seen late last year and early this year. And, somehow there seems to be room and reason (momentum) for the composite to keep chugging higher. Notice the volatility index (VXN) at the bottom chart isn’t exactly near its absolute floor around 15.0.
NASDAQ Composite Weekly Chart, with VXN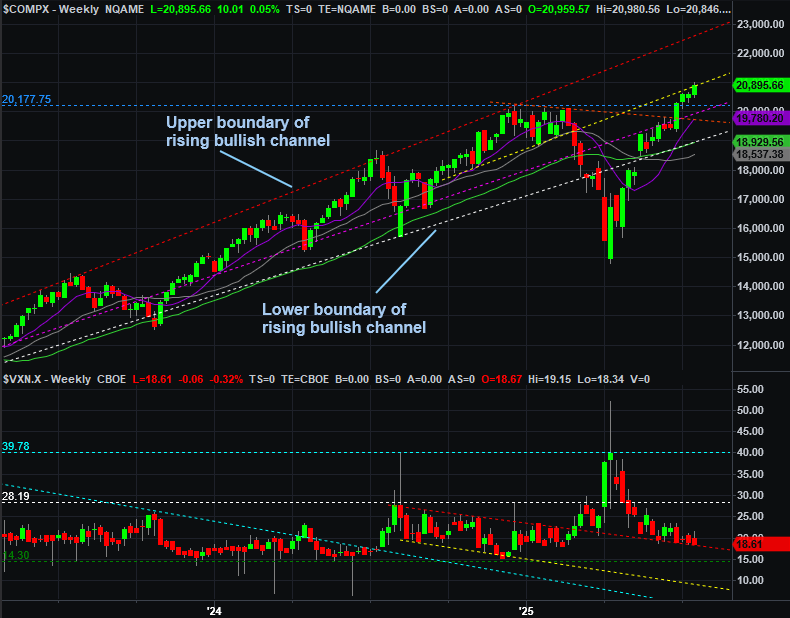
Source: TradeNavigator
Here’s the daily chart of the S&P 500 for a little more detail and context. The advance doesn’t exactly look wholehearted here, with several minor intraday setbacks suffered all week long. This might actually be a good thing though. If nothing else, this pace is sustainable. There’s also reasonably-healthy volume behind the move.
S&P 500 Daily Chart, with VIX and Volume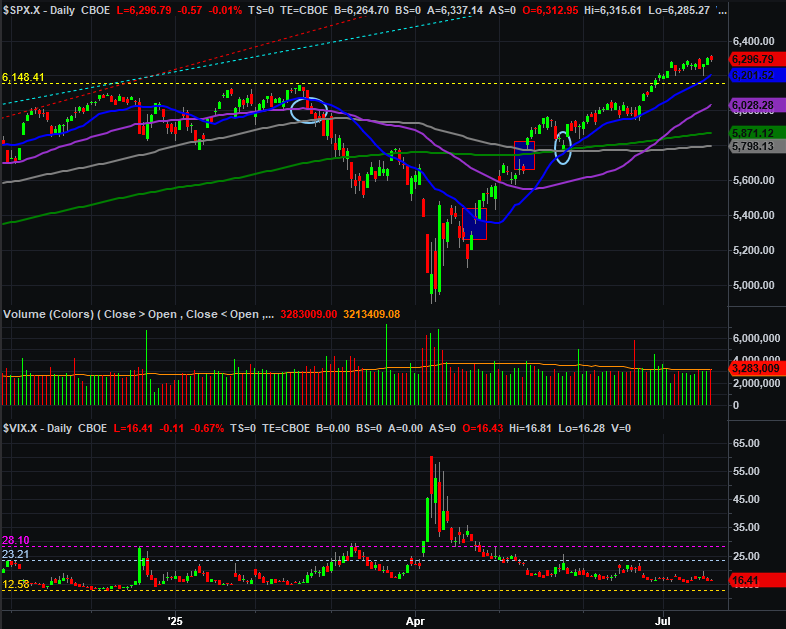
Source: TradeNavigator
There are legitimate worries, to be clear. In addition to all the pent-up technical profit-taking potential now on the table, the market’s fundamentally expensive. The S&P 500’s trailing price/earnings ratio of 24.7 is very rich by historical standards… unsustainably frothy.
Just be careful of presuming what the market’s going to do for valuation reasons while there’s so much bullish technical support still in play. As has been pointed out several times now, all of the indexes’ moving average lines below their current levels are providing enormous floors that could bring a quick end to any pullback effort. Let’s assume that’s how things will play out -- if tested -- until we can’t assume that anymore.