Weekly Market Outlook - Stocks Pull Off a Huge Last-Minute Win

For a while last week it looked like the market might slip back into trouble, largely on fears of debt-ceiling gridlock in Washington DC. The partisan haggling actually ended up making encouraging progress on Friday though, prompting traders to step back in.
While the win itself was relatively modest, it was important all the same. With that one big move, the S&P 500 fought its way back above some major resistance levels. Now all of its most likely resistance is in the rearview mirror. Maybe it's there to stay.
We'll look at the matter in detail below. First, let's take a look at last week's most important economic announcements and preview the big news that's in the queue for this week. There's still plenty of good opportunity to undermine this rally.
Economic Data Analysis
Last month's sales of existing homes may have been a disappointing drop from March's figure, bit sales of new homes continue to recover from last year's multi-year low. April's annualized pace of 683,000 new-home sales, in fact, is the fastest pace we've seen since early 2022 when they were on the way down.
New, Existing Home Sales Charts
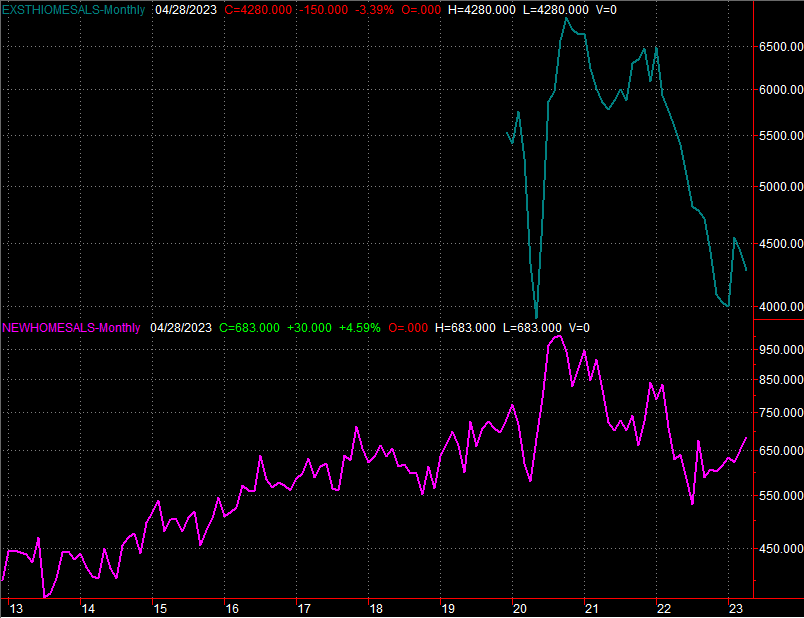
Source: Census Bureau, National Association of Realtors, TradeStation
It's not entirely clear why new-home sales are rebounding so much faster, although it's likely got a lot to do with pricing and a limited amount of inventory. Homebuilders and consumers both know what a new home is worth. Current homeowners are seemingly still clinging to last year's inflated pricing power. Nobody's nibbling.
The only other item of interest posted last week was the third and final look at the University of Michigan's consumer sentiment score. It fell -- and by more than a little -- rekindling the downtrend that took shape in March. We won't hear the Conference Board's measure of consumer sentiment until this week, but like the U of M reading, it's apt to extend its bigger-picture downtrend as well.
Consumer Sentiment Charts
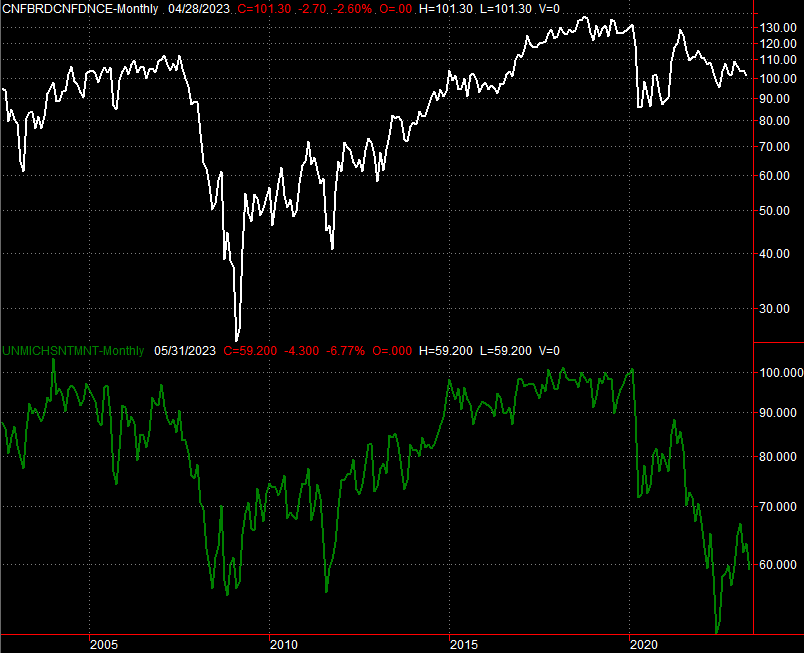
Source: University of Michigan, Conference Board, TradeStation
Everything else is on the grid.
Economic Calendar
Source: Briefing.com
This week will also round out May's look at the real estate market with the month's key real estate pricing measures. On Tuesday we'll hear March's FHFA Housing Price Index along with the S&P Case-Shiller report. Things have been holding surprisingly steady on this front so far. But, economists think this is when we'll finally start to see things crack. They're calling for a 2.3% year-over-year tumble of the Case-Shiller 20-City Home Price Index, which will all but renew the slide that started in the middle of last year.
Home Price Index Charts
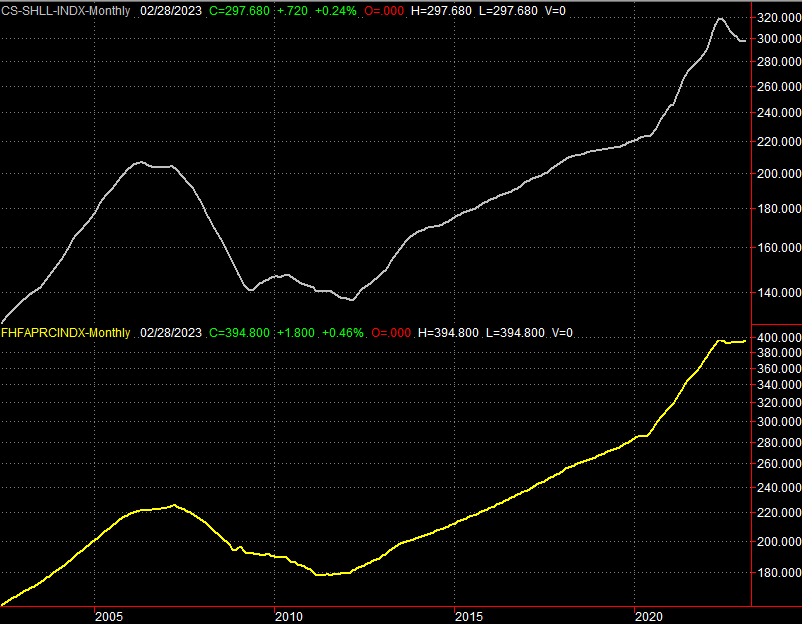
Source: Standard & Poor's, FHFA, TradeStation
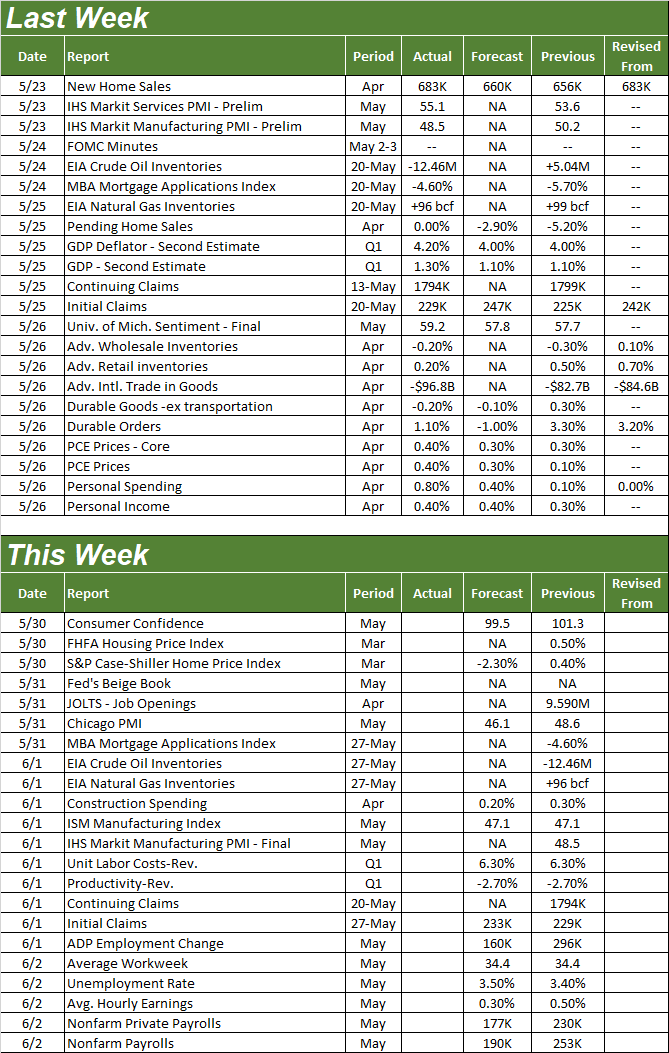
This week's big Kahuna, however, is Friday's jobs report. You may recall things have been oddly strong on this front of late, particularly in light of so many layoffs in the tech sector. Yet, things are still expected to remain...ok. Although the 190,000 new jobs projected won't be enough to prevent the unemployment rate from edging up from 3.4% to 3.5%, both of the numbers are still pretty healthy.
Payroll Growth, Unemployment Rate Charts
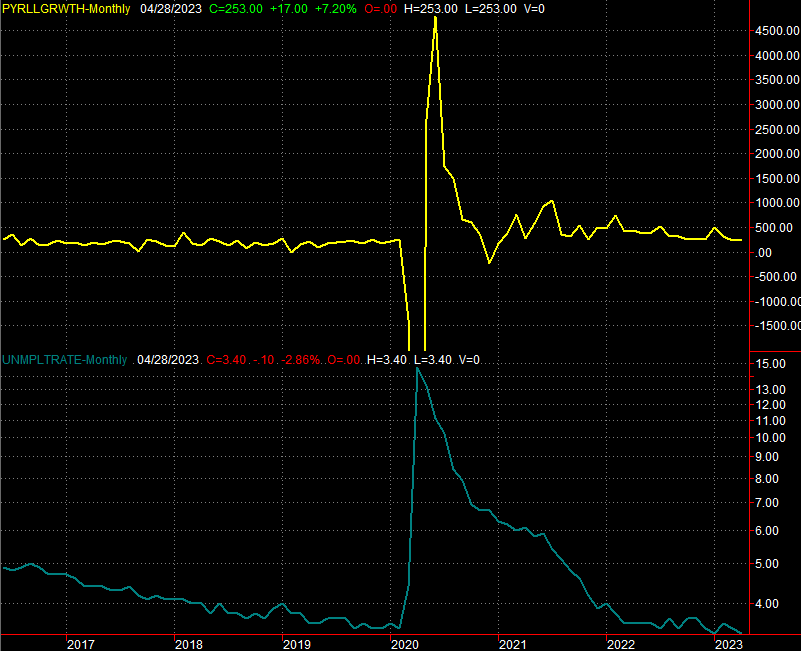
Source: University of Michigan, Conference Board, TradeStation
Stock Market Index Analysis
The market spent the bulk of last week in the red. When push came to shove on Friday though - and when it looked like an amicable debt-ceiling deal might be reached - it was the bulls doing the shoving. The S&P 500 ended last week with a gain of a little over 1.0% for the five-day stretch. And, more important, the index ended the week back above a couple of major resistance lines. Check out the daily chart below.
S&P 500 Daily Chart, with VIX and Volume
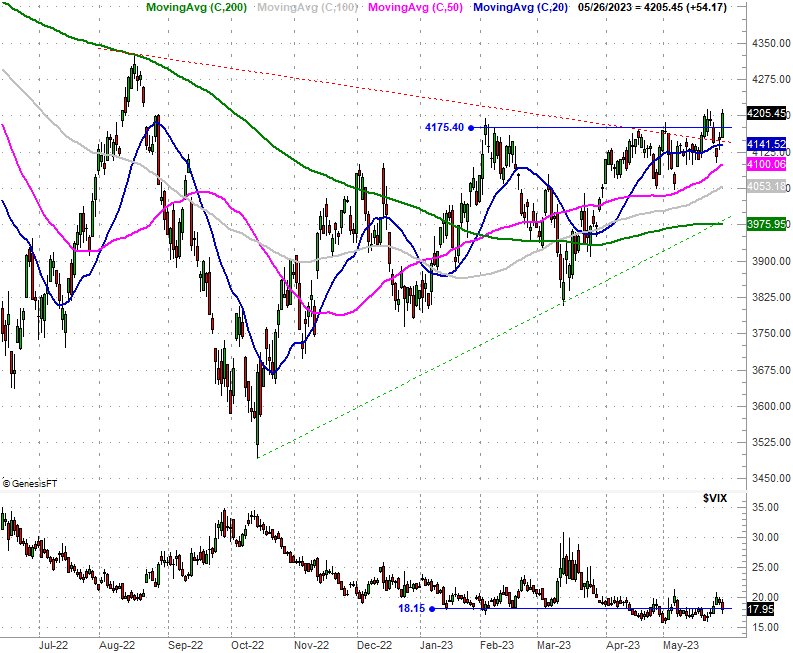
Source: TradeNavigator
The weekly chart of the S&P 500 offers a little more perspective on this (re)breakout out. There is no bearish technical ceiling left to hurdle. The recent higher high also follows March's higher low (higher than October's low). The tide is clearly pointed in a bullish direction.
S&P 500 Weekly Chart, with VIX and Volume
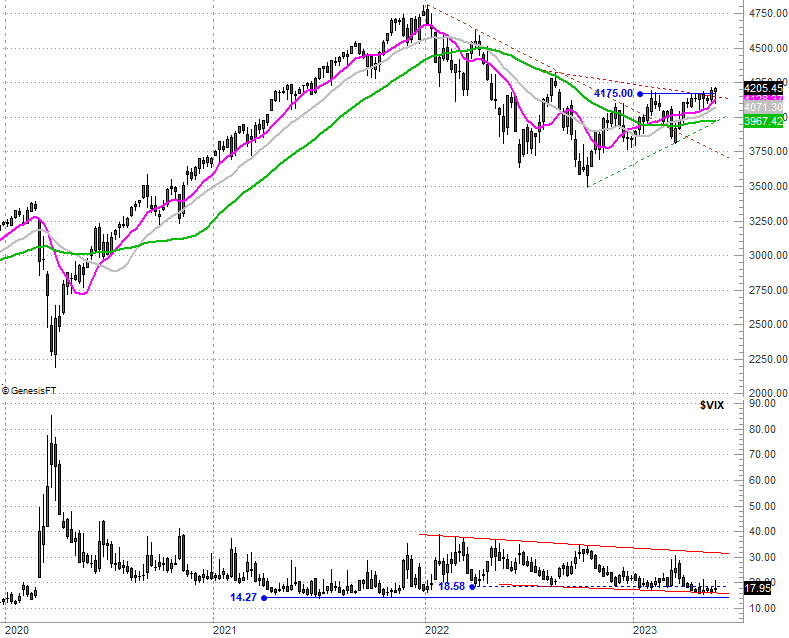
Source: TradeNavigator
There's still a nagging problem ultimately standing in the way of the rally though. That's the S&P 500's volatility index, or VIX. It's too low. That's not to suggest stocks can't continue advancing with investors being this optimistic. But, it certainly doesn't help the bullish argument.
And the NASDAQ Composite's got the same basic problem... almost. Unlike the VIX, the NASDAQ's volatility index (VXN) does look like it's starting to fight its way higher now, pushing up and off of a convergence of a couple of technical support levels. If it continues to push its way upward, that will coincide with bearish pressure on the NASDAQ Composite itself.
On the other hand, it sure doesn't look like the composite's having any real trouble making forward progress here.
NASDAQ Composite Daily Chart, with VXN
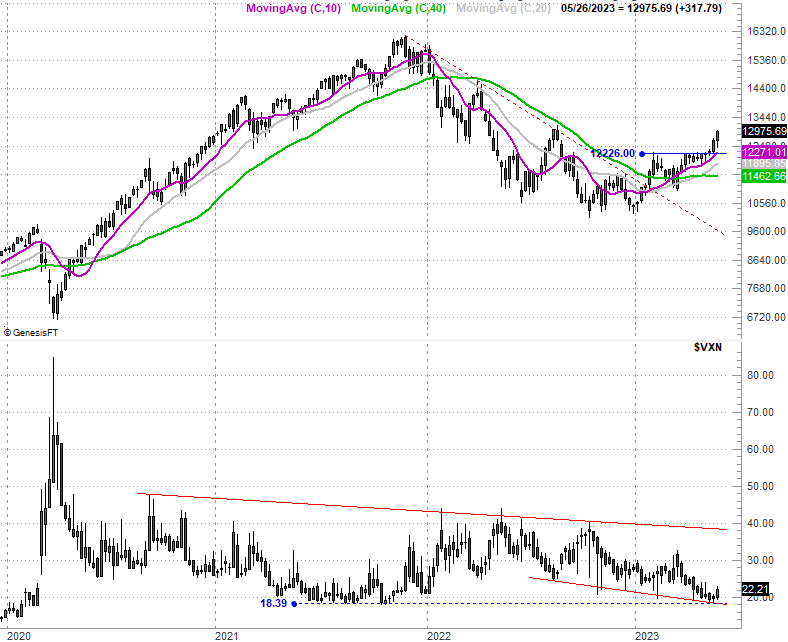
Source: TradeNavigator
Broadly speaking, the trend is your friend, meaning you should trade in the direction of the trend until it's clear you just can't any longer. More to the point, that means you should be thinking bullishly here. Just respect the fact that even the short-term trend can be bullish and still allow for the occasional stumble. That's certainly possible now, particularly in light of last week's huge 2.5% rally from the NASDAQ, and its two-week gain of 5.6%. There plenty of profits to be taken.
The key is where any pullback ends. As long as one of the key moving average lines normally used by technical analysts acts as a floor [and we've plotted all four of the favorite moving average lines for both indices above], any such dip is a buying opportunity.