Weekly Market Outlook - Stocks Finally Move Over the Hump. Now What?

It wasn't much of a win, for the day or for the week. Nevertheless, the market's small gain on Friday was just enough to get at least one key index over a major technical hump following a week's worth of slow, painstaking progress.
We're still battling the calendar; this is supposed to be a lethargic (if not bearish) time of year. There's also the not-so-small matter of stocks being well overbought thanks to last year's enormous runup. The momentum remains bullish though, and there's more room to keep rising before we bump into any technical ceilings.
We'll look at the whole thing in detail below. Before we get to it though, let's take a look at last week's major economic reports and preview what's coming this week. Spoiler alert: There's plenty in the lineup that could move the market.
Economic Data Analysis
We saw a fair amount of economic data last week, including job openings numbers. None of it was all that riveting though, save one item... inflation, or at least the first look at May's snapshot. As was expected, prices for consumers rose quite a bit again, but by even more than expected. The overall annualized inflation rate now stands at 5.0%, versus expectations of "only" 4.7%. Not counting gas or food, inflation is still a hefty 3.8%. Both are multi-year high levels.
Consumer and Producer Inflation Rate Charts
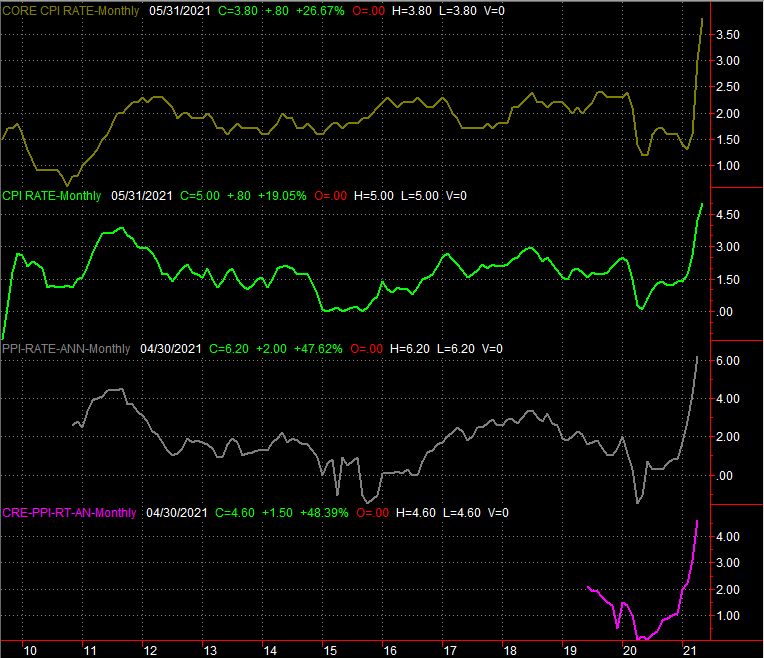
Source: Bureau of Labor Statistics, TradeStation
Both figures need to be kept in perspective. We're now just a little bit past the one-year mark from when the pandemic really started to wreak havoc on the economy. These price hikes are exaggerated. On the other hand, with so much cheap-and-easy money now in circulation, at least some of these price increases have to be attributed to that.
The Federal Reserve's Open Market Committee doesn't seem to be sweating it. The FOMC is scheduled to make a decision about interest rates this week, however, which may indicate otherwise... particularly once the producer inflation figure is posted on Tuesday. (Even if rates remain unchanged, keep your eyes and ears open for changing rhetoric.)
Everything else is on the grid.
Economic Report Calendar
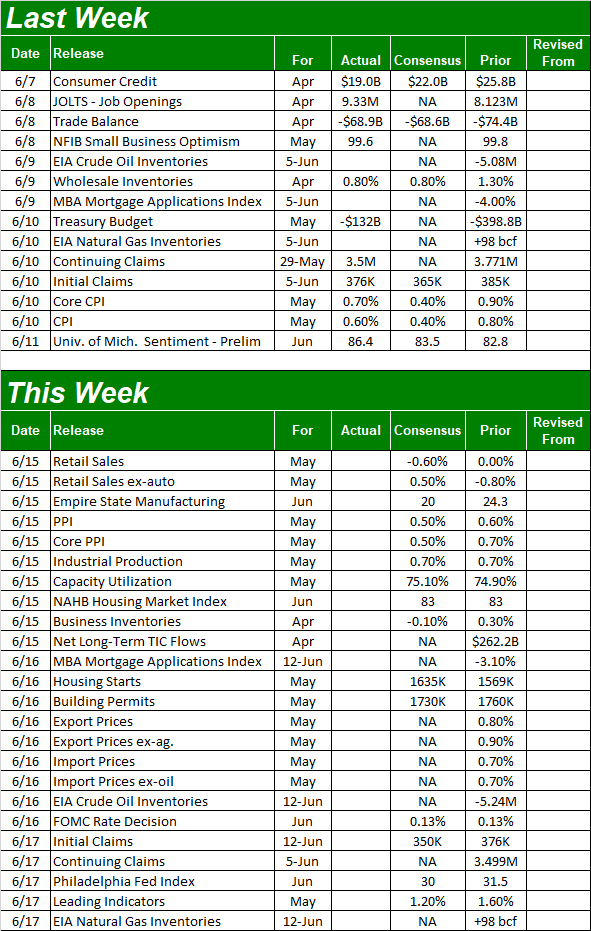
Source: Briefing.com
Aside from May's consumer inflation numbers on Tuesday and Wednesday's interest rate decision, this week is still a big one. Also on Tuesday we're due for last month's retail sales data, and May's capacity utilization and industrial productivity reports.
Retail sales are projected to have stabilized, or flatten, for the past couple of months following March's stimulus-spurred surge.
Retail Sales Charts
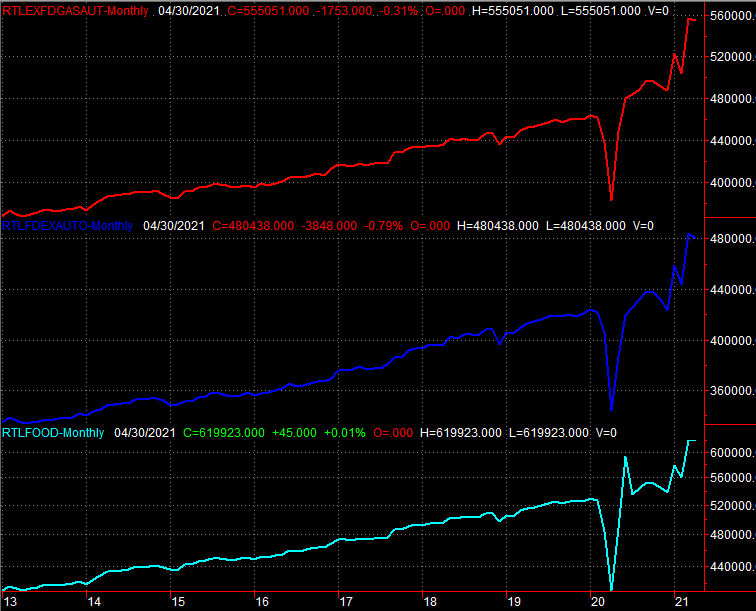
Source: Census Bureau, TradeStation
As for industrial activity though, economists believe it's still growing, in step with the gradual reopening of the country and the economy as COVID-19 abates. We're still well below pre-pandemic levels on this front, but the direction we're moving is more important than the absolute number.
Capacity Utilization and Industrial Productivity Charts
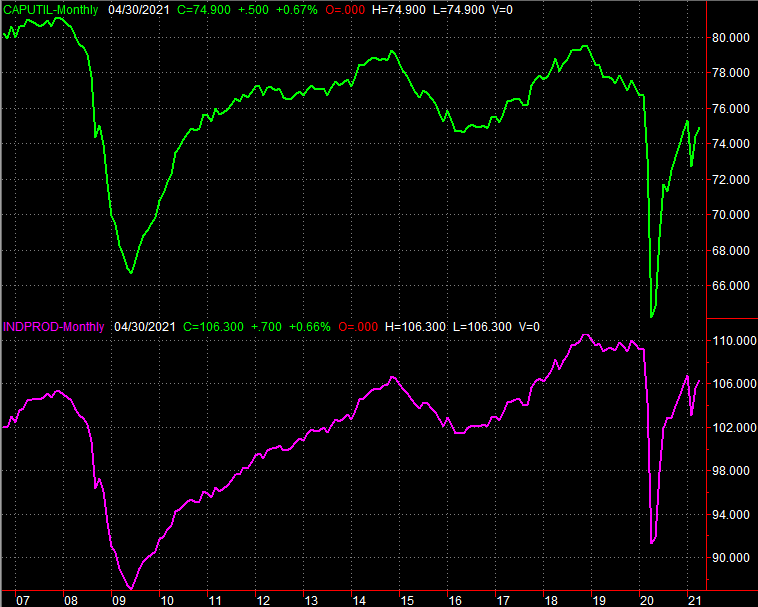
Source: Federal Reserve, TradeStation
The only other item of any real interest coming this week is Wednesday's housing starts and building permits report, which kicks off a couple of weeks' worth of real estate data. Economists are forecasting more of the same strength for these two measures, coinciding with purchases and persistent gains in home values.
Housing Starts and Building Permits Charts
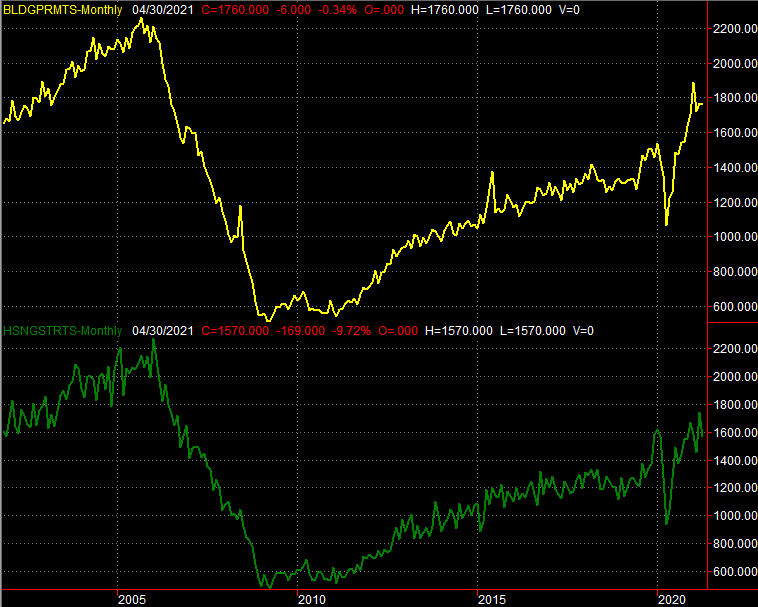
Source: Census Bureau, TradeStation
Stock Market Index Analysis
It was anything but a thrilling move, but it worked all the same. The S&P 500 inched its way past a key technical ceiling near 4238 to end the week at an all-time record close of 4247.44. The slow pace of this progress makes it more likely to last a while despite a time of year that's supposed to be weak for the market. Take a look.
S&P 500 Daily Chart, with VIX and Volume
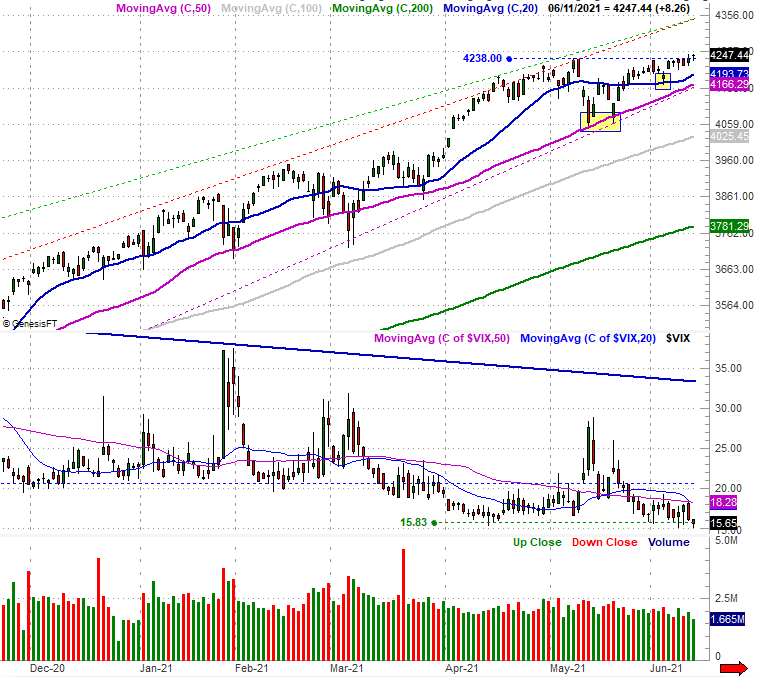
Source: TradeNavigator
Notice how the index is still closer to the lower edge of a rising trading channel (plotted with dashed lines) rather than the upper boundary, meaning there's room for more upside before the next ceiling is hit. Also notice the index's most important technical support lines -- the 20-day (blue) and 50-day (purple) moving average lines -- held up as support the last times they were tested (highlighted in yellow). This current move is surprisingly well-grounded.
It's far from an ideal scenario, however.
Yes, the "too low" VIX is a problem. While the market can continue to rally even if the volatility indices are at unusually low levels, this makes it more difficult to do so.
That's not the chief concern for the bulls right now, however. Of far greater concern is the fact that volume continues to deteriorate on the way up. Rallies should gain volume as they move forward, as more and more buyers are what fuel a rally; at the very least volume should hold steady. Traders, however, are losing interest (or at least losing willingness) the higher stocks climb.
Here's the weekly chart, for a little added perspective.
S&P 500 Weekly Chart, with VIX and Volume
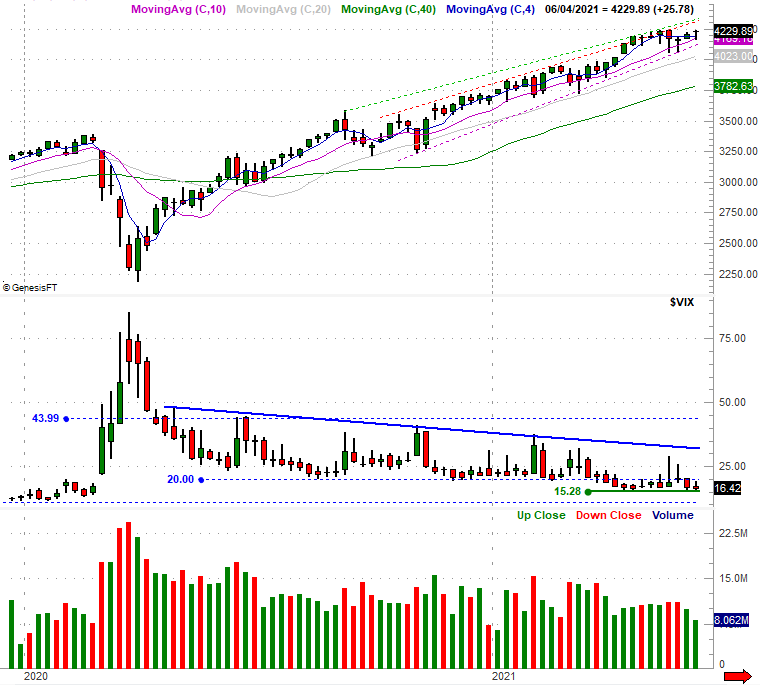
Source: TradeNavigator
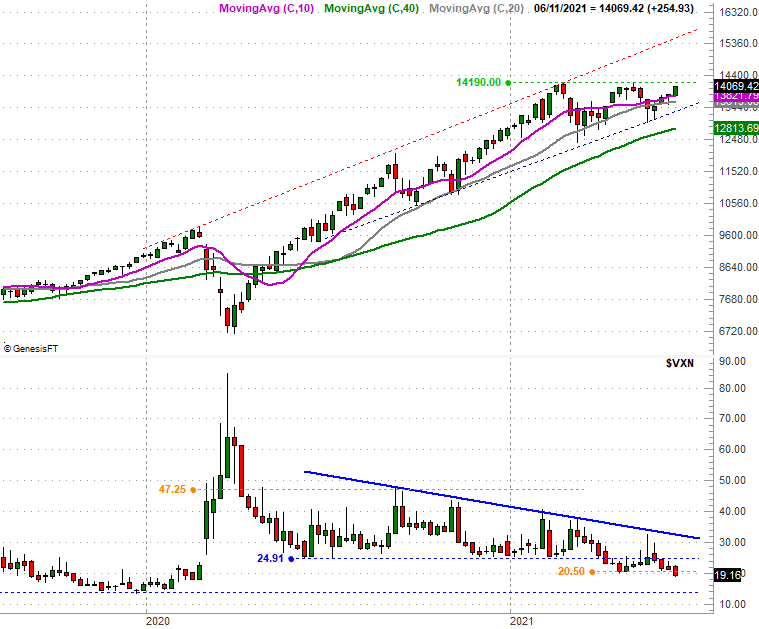
The NASDAQ Composite has been through a similar - although not identical - process. It didn't tiptoe into record-high territory at the end of last week. It's clearly moving higher though, with lots of room to continue doing so. There's a technical ceiling near 14,190 that needs to be hurdled, but if the composite can get over that hump, there's not another ceiling in sight until 15,585 (and rising).
NASDAQ Composite Daily Chart, with VXN
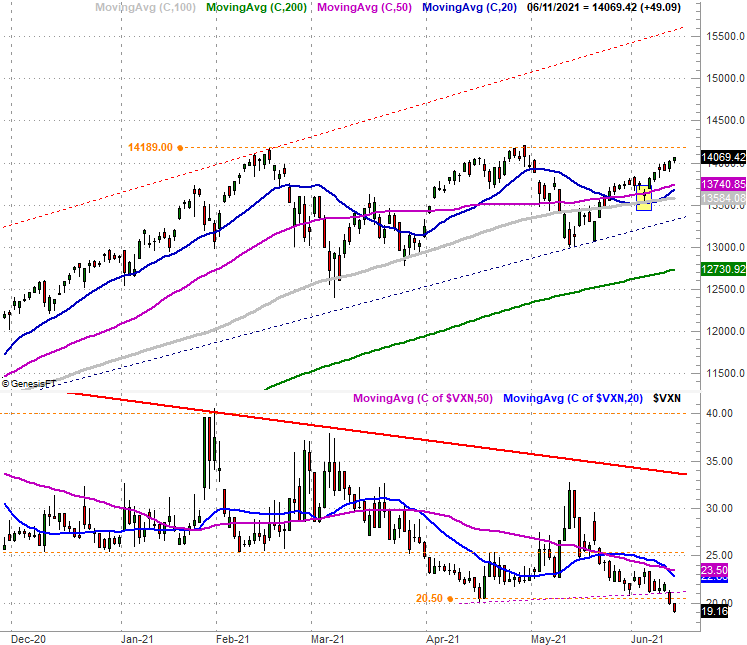
Source: TradeNavigator
The weekly chart of the NASDAQ Composite... for your consideration. Like the S&P 500's VIX, the NASDAQ's VXN appears to be in a well-formed downtrend. It's not at an absolute low until 13.5, where it was in the few weeks before the advent of COVID-19 pandemic up-ended the market.
NASDAQ Composite Weekly Chart, with VXN
Source: TradeNavigator
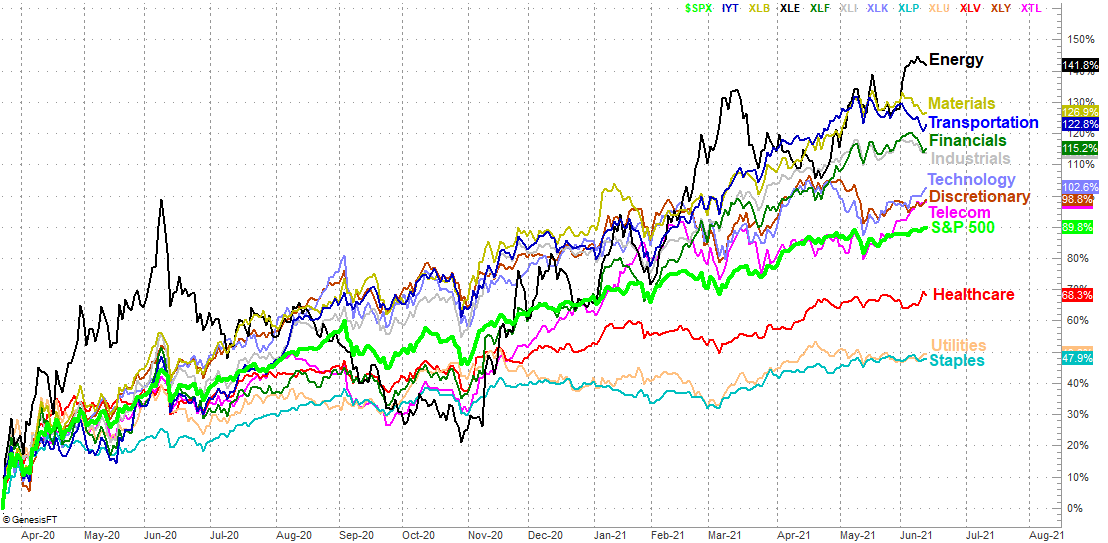
While we're waiting for the market to do what it's going to do (and since it's been a while since our last one), we'll close out this week's analysis a with a look at relative sector performance. As you can see - and surprisingly enough - consumer staples have lagged the entire market since the lows hit in March of last year despite the importance of staples and basics during that time. Equally surprising is how energy stocks led the way. While oil and gas prices did rebound from that initial shock, they've still been more low than not. The energy sector's names rallied anyway.
Sector Performance Chart, since March 23rd, 2020
Source: TradeNavigator
Regardless, we're seeing some curious budding strength on some fronts. Telecom stocks are taking off, and technology stocks are renewing their strength nicely. We've also got prospective breakdowns (driven by profit-taking) in materials and transportation stocks, though neither has taken a fatal blow just yet. It's just something to put on your radar. We'll update this chart if any of these small changes turns into something more.