Weekly Market Outlook - Stocks Back Away From the Brink, Bouncing Back Into Bullish Mode
After a modest washout through Wednesday's action, the bulls stepped up to the plate on Thursday in a huge way, logging the biggest daily win for the market since March. Friday's follow-through sealed the deal, leading the indices back above some key lines in the sand, and topping off what turned out to be a 1.8% advance for the five-day stretch.
And yet, things were so good last week that they're actually a little bit bad. Most of the indices left behind not one but two daily gaps, and the volatility indices have fallen back to established technical floors. This leaves the market overexposed to potential profit-taking.
We'll look at all of this below. First though, let's run through last week's key economic announcements and preview what's in the pipeline for this week.
Economic Data Analysis
Last week's big economic data report was of course the inflation snapshot for September. There's still plenty of it. Consumers are paying 5.4% more for goods and services than they were a year ago, but even stripping out ever-volatile food and gas prices, the annualized consumer inflation rate still stands at 4.0%. Producers (factories, assemblers, bundlers, compilers, etc.) are facing cost increases of 8.6%, or 5.9% on a core basis.
Consumer, Producer Inflation Charts
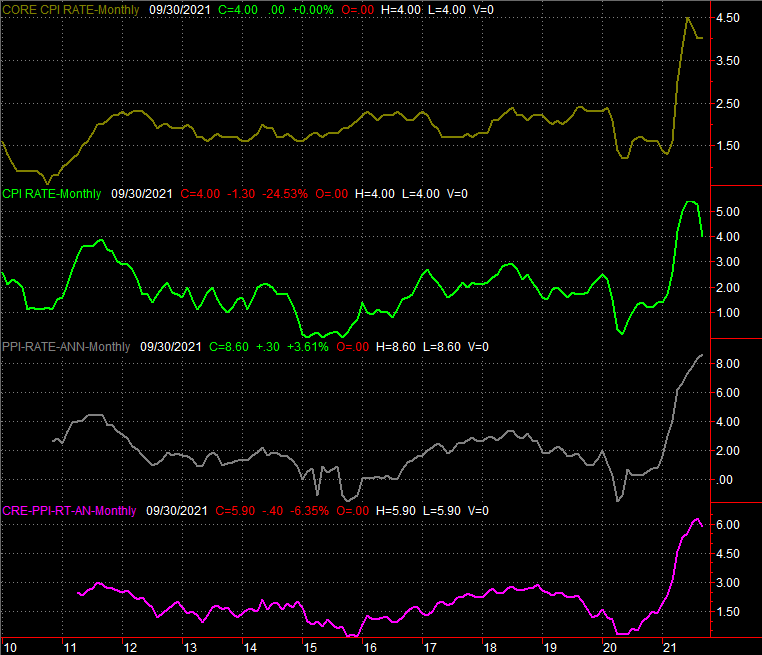
Source: Bureau of Labor Statistics, TradeStation
Inflation isn't just a problem. It's a persistent problem. The Federal Reserve has seen this coming for months, and has acknowledged this year's soaring prices will requite action sooner or later. But, the FOMC's current projections are only calling for one or two rate hikes next year, and maybe one or two hikes in 2023. That may not be soon enough to undo the damage being done by high prices now.
The only other data of real interest from last week is retail sales figures. They were surprisingly good. Consumerism jumped 0.7% compared to August's reports versus an expected drop of 0.2%, and were up 13.9% year over year... although gasoline price hikes drove much of that increase. Taking automobile sales out of the picture, retail spending grew 15.6%.
Retail Sales Charts

Source: Bureau of Labor Statistics, TradeStation
The consumer continues to be one of the bright spots of this economy.
Everything else is on the grid.
Economic Calendar
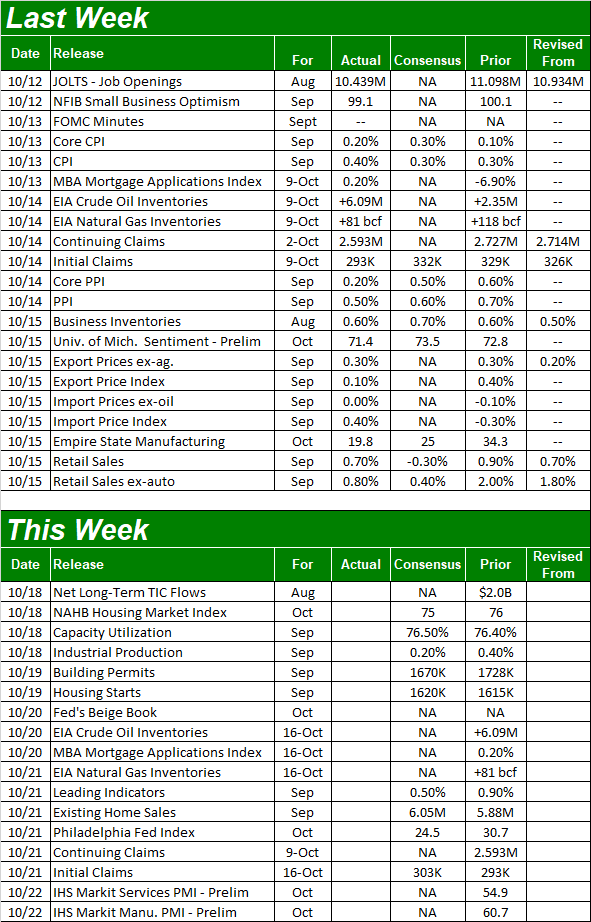
Source: Briefing.com
This week's got a couple of major news items in the queue, starting with Monday's look at last month's capacity utilization and industrial productivity data. Both have been firm -- and rising -- of late, indicting economic growth/recovery. Look for more of the same this time around.
Capacity Utilization and Industrial Productivity Charts
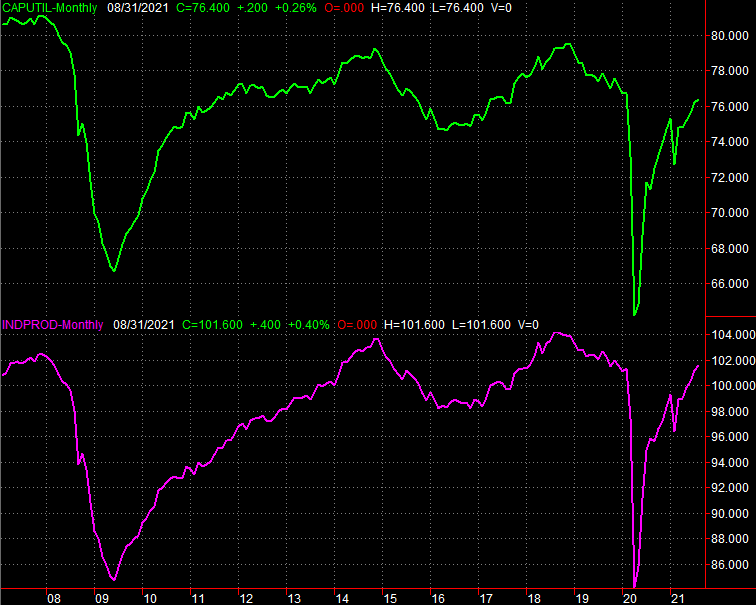
Source: Federal Reserve, TradeStation
It's also going to be a huge week for real estate. On Tuesday we'll get last month's building permits and housing starts data, and on Thursday look for September's existing home sales report. Starts are expected to be about even with August's levels, although that bigger trend is also a bullish one. Permits are projected to grow by a good bit, accelerating a recovery of the bigger uptrend that was put into place last month. Sales of existing homes are expected to edge higher too, though only by a little; a lack of inventory continues to be a challenge.
Housing Starts and Building Permits Charts

Source: Commerce Department, TradeStation
New and Existing Home Sales Charts
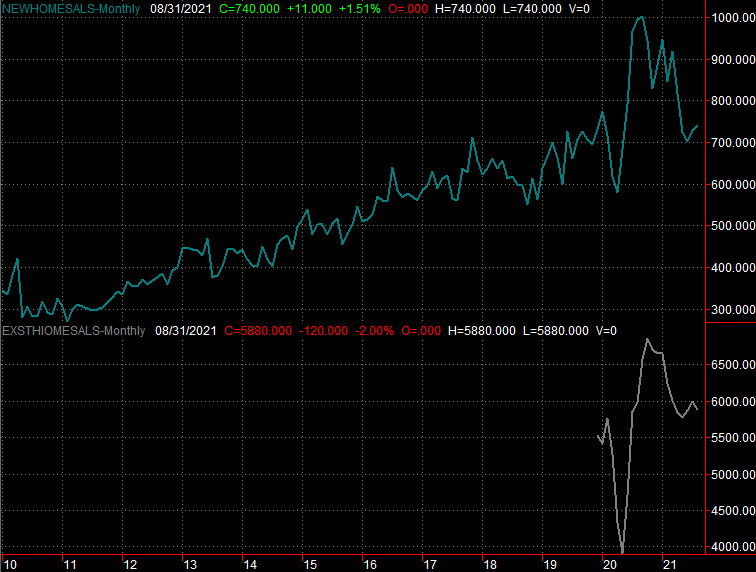
Source: National Board of Realtors, Census Bureau, TradeStation
Last month's estimated sales of newly-built homes will be released next week.
Stock Market Index Analysis
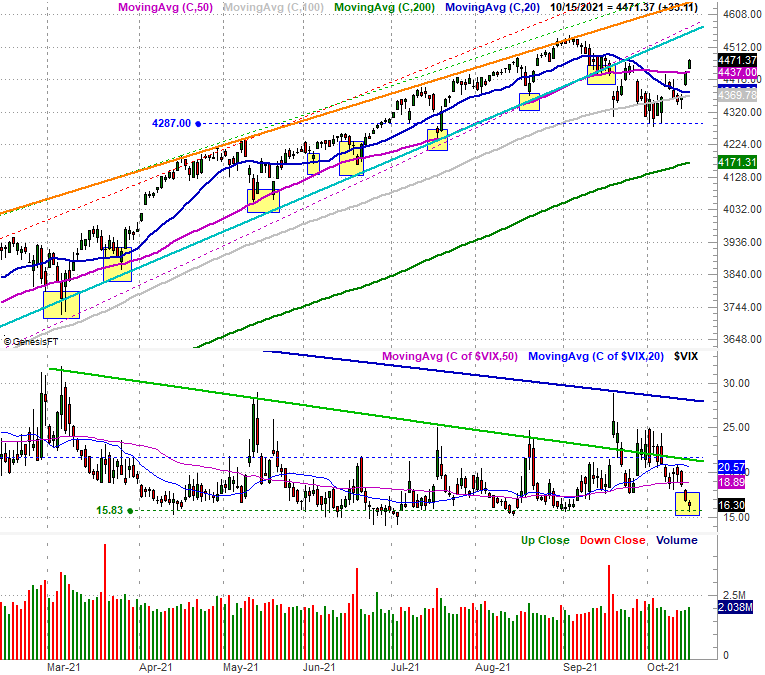
The good news: The S&P 500 logged a gain of 1.8% last week... the best week since July, moving above some important technical ceilings in the process. The bad news: The index didn't exactly set itself up for great follow-through.
Take a look. The S&P 500 managed to push its way back above the 20-day (blue) and 50-day (purple) moving average lines. But, it also left behind a gap on Thursday and then again Friday. This translates into bearish pressure headed into this week's trading action. Also notice the S&P 500 Volatility Index (VIX) has been dragged back to a well-established floor around 15.8 (dashed) that's been hit around the time the market itself is topping out.
S&P 500 Daily Chart, with VIX and Volume
Source: TradeNavigator
That's not necessarily a call for a pullback, or even a blip. The VIX can linger at low levels for some time while stocks rally. The volume behind the rebound for the past two days of last week was also, while not thrilling, at least firm. There's also a chance that the S&P 500 could merely ease back to its 100-day moving average line (gray) at 4370 to close those gaps and then rekindle this young rally. We'll just have to wait and see if that's what shakes out.
The NASDAQ Composite looks more or less the same. That is, it too bounced back above its 20-day (blue) and 50-day (purple) moving average lines. But, that big move left behind a couple of bullish gaps to be backfilled. The NASDAQ's volatility index also plunged to levels generally seen when the index is at or near a top.
NASDAQ Composite Daily Chart, with VXN
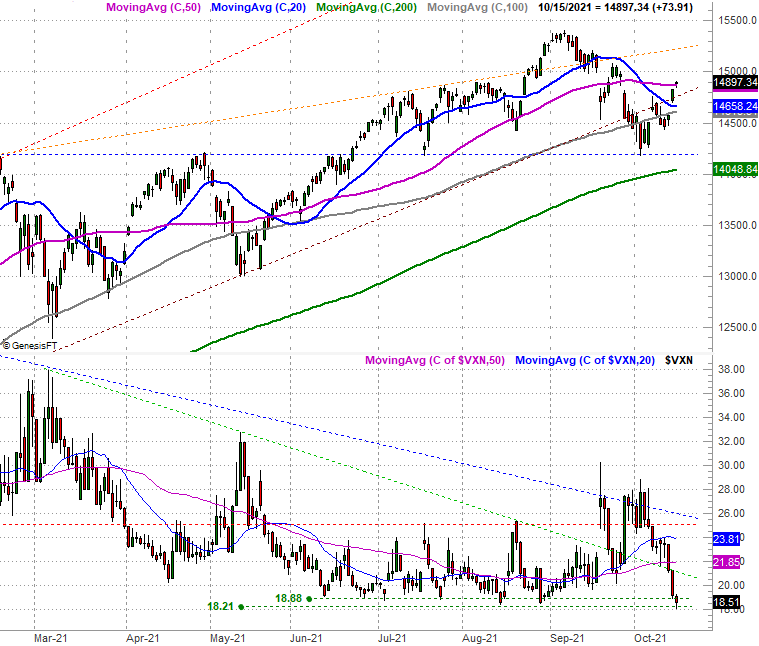
Source: TradeNavigator
Ditto for the Dow Jones Industrial Average.
Dow Jones Industrial Average Daily Chart, with Volume

Source: TradeNavigator
There's a curious exception to this late-in-the-week rally though. While the Russell 2000 small cap index logged a gain for the week, it gave up all of its intraday gains on Friday to close at the low for the day. Traders were making a point of getting out of these names while they were piling into the large caps that make up the other key indices. That move pulled the index back within its narrowing trading range (red) that had finally been broken - albeit briefly - that day.
Russell 2000 Daily Chart, with Volume
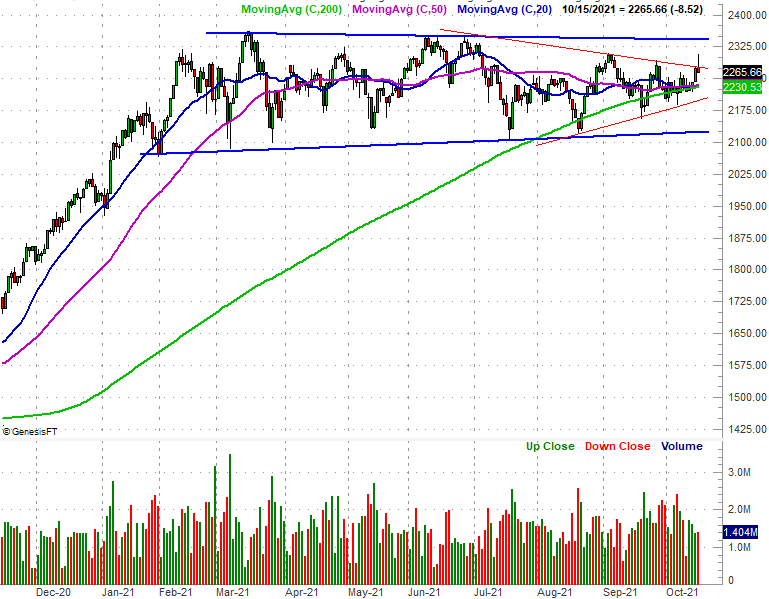
Source: TradeNavigator
We've talked about this a few times in recent weeks... the either/or situation. Traders will swap out their small caps for large caps, or vice versa. Here they're clearly trading in their smaller names to scoop up the market's biggest names again. That's ultimately a bullish backdrop.
This week is going to be a wait-and-see kind of week. In an ironic twist, the worst thing that could happen for the market is a strong start out of the gate. It's already vulnerable and a little ripe for profit-taking, and a bit more bullishness ahead only raises the odds of starting a pullback that doesn't continue to drag the indices under key technical floors. The ideal thing for the bulls here is actually a small, short-lived lull to bleed off some of the pressure in place now so the rally can be renewed in a healthier, more sustainable way.
We'll see.