Weekly Market Outlook - On the Fence and In No Hurry
 The bleeding finally stopped on Friday, with the S&P 500 mustered a 1.42% gain. But, by that time, the damage had been done. The market lost a little more than 4.0% of its value last week... the worst week since March, which materialized at a time that's not all that great for stocks to begin with.
The irony? The best thing going for the market right now was also the worst thing about last week. That is, the sheer severity of the selloff sets up the strong possibility of a dead-cat bounce this week. Just take any such bounce with a grain of salt, as there's certainly no guarantee it will last.
To make sure traders are fully vexed, the S&P 500 closed last week right on a pivotal technical level.
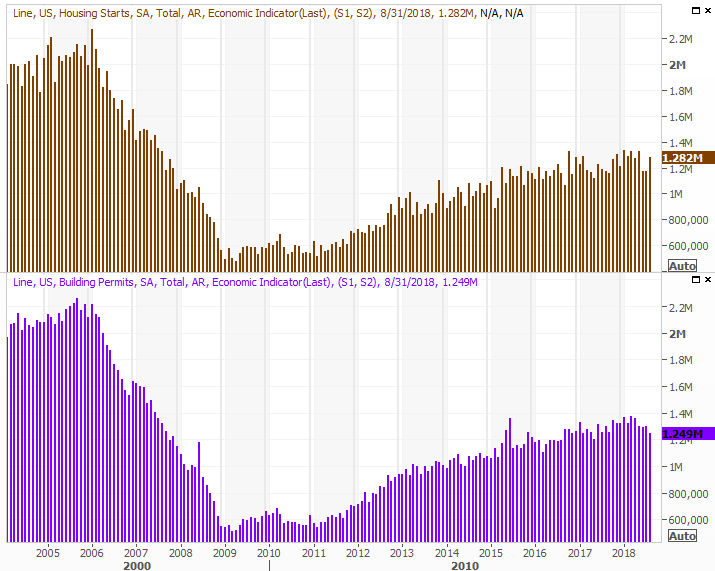
We'll weigh it all below, right after a rundown of last week's economic news and a preview of this week's economic announcements.
Economic Data
Last week's big news was a look at September's inflation rates. Though there's still enough of it to keep the Fed's plan for interest rate hikes on track, it's not rampant - the Fed's plan is working. The overall inflation rate for consumers cooled again, to an annualized pace of 2.3%. Taking food and gas out of the equation, inflation fell to 2.2%. That's more in line with the Fed's target, and the right balance between 'too much' and 'not enough.' Producers are also finding some much-needed input price stability.
Inflation Rate (Annualized) Charts
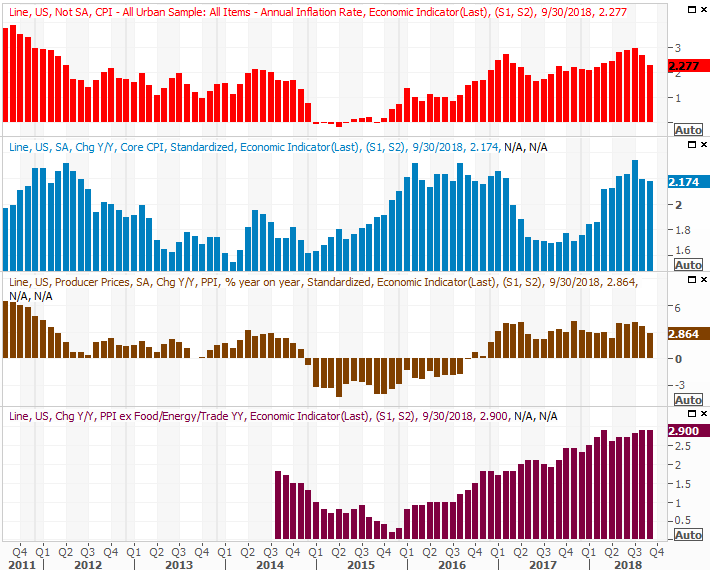
Source: Thomson Reuters
The slowing uptrend gives the Federal Reserve some wiggle room if it wants to ease up on the hawkishness, which is actually beneficial for stocks.
While that was the biggie for the week, it wasn't the only item of interest. We've also been keeping tabs on natural gas and crude oil inventories, particularly given the renewed fears of supply disruptions. If that's going to be a problem, it certainly isn't yet. For a third week in a row stockpiles grew, and they appears to be accelerating.
Crude Oil, Natural Gas Inventory Charts
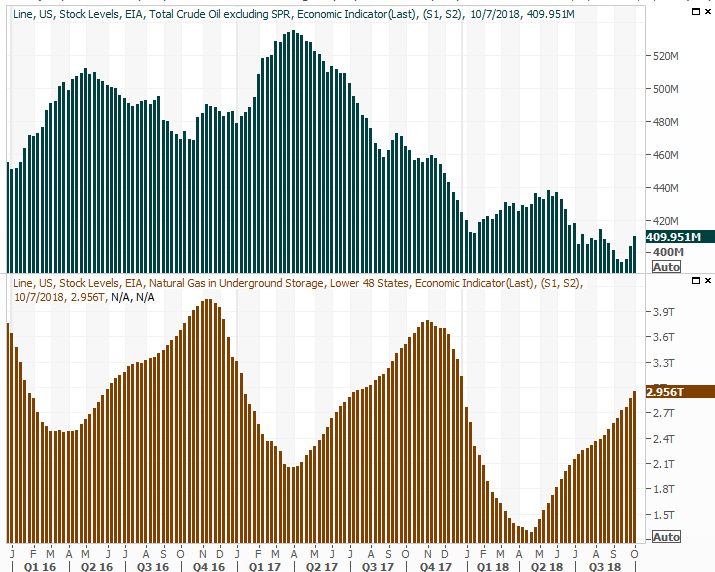
Source: Thomson Reuters
It's difficult to determine exactly why. Hurricanes could get some of the blame, as refiners will shut down to abate damage and prevent ecologic problems. That can cause a backup. But, there may be more to this increase than the recent hurricane. It's something worth monitoring either way, as crude prices continued to firm up last week when they arguably shouldn't have.
Everything else is on the grid.
Economic Calendar
Source: Briefing.com
This week is going to be a bit busier, though any economic news is apt to take a back seat to earnings reports as earnings season gets going in earnest. You may want to make a point of keeping your eyes and ears open for the biggest announcements, which begin with...
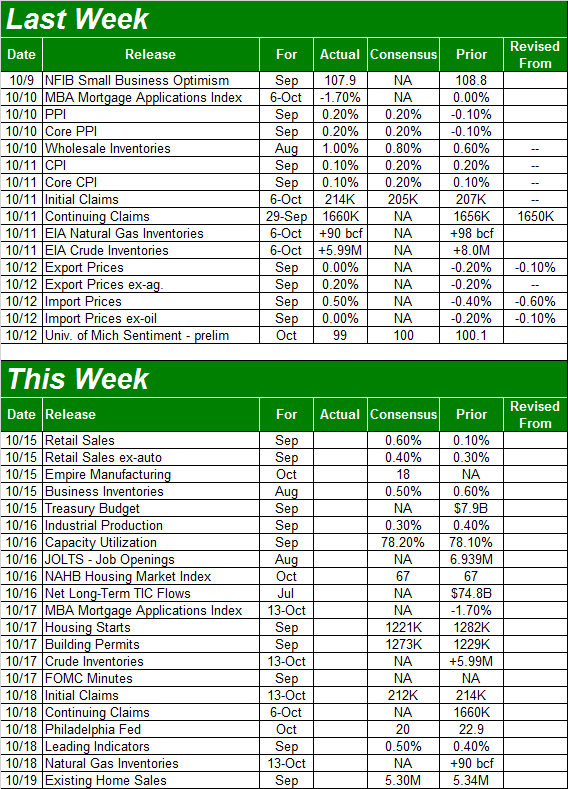
... last month's retail sales report, due on Monday. Economists expect them to not only grow again, but accelerate from August's slowdown.
Retail Sales Growth (Annualized) Charts
Source: Thomson Reuters
The trend here remains bullish in a bigger-picture sense. Two-thirds of the U.S. economy is consumer driven, and as long as consumers aren't afraid to spend more of their rising incomes, corporate earnings growth should remain intact.
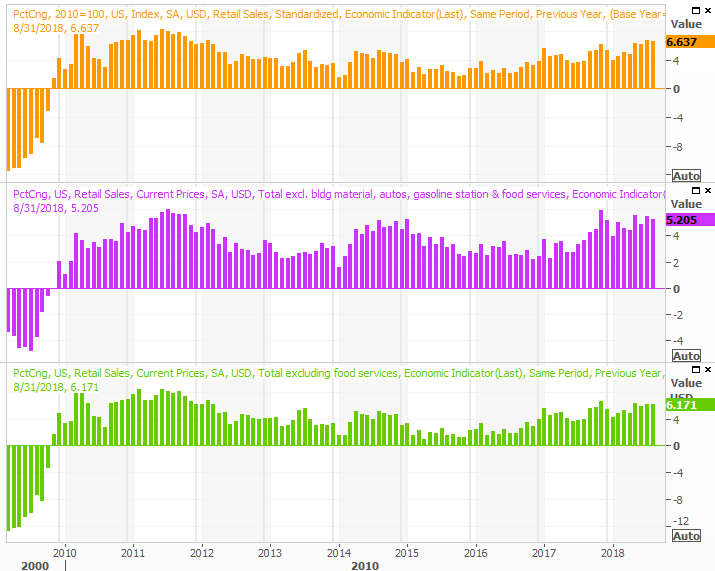
There's another major report coming on Tuesday, though it's often overlooked - last month's capacity utilization and industrial productivity report. Both have been trending higher quite nicely, in step with improving economic strength. Economists are calling for more progress, which bodes well for the long-term market even if it can't stave off a short-term pullback.
Industrial Production and Capacity Utilization Charts
Source: Thomson Reuters
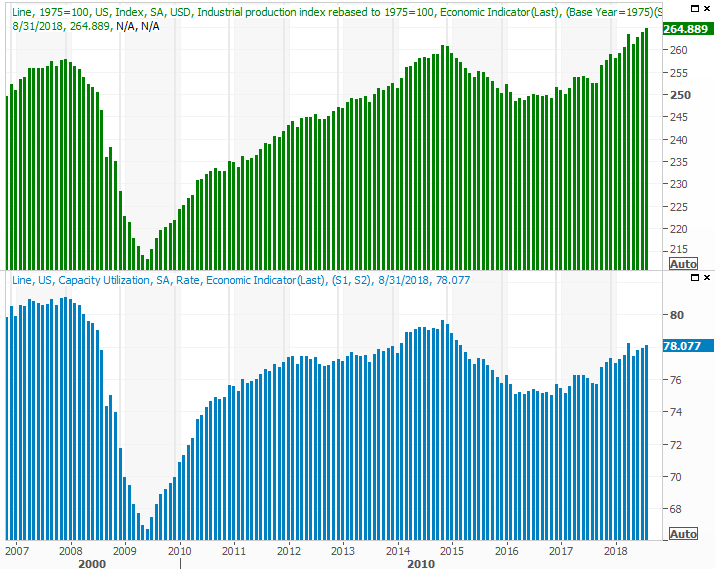
We're also going to get a good look at the nation's real estate picture, though the pros aren't calling for any real improvement. Housing starts and building permits should more or less be even with August's figures when we get September's figures on Wednesday. The numbers are leveling off, however, at fairly unimpressive levels.
Housing Starts and Building Permits Charts
Source: Thomson Reuters
Then on Friday we'll hear about September's sales of existing homes. The new homes report won't be posted until next week, but notice that both are leveling off at less-than-peak levels seen just a few months ago. Economists are calling for a slight decline - again - in sales of existing homes.
New and Existing Home Sales (Annualized) Charts
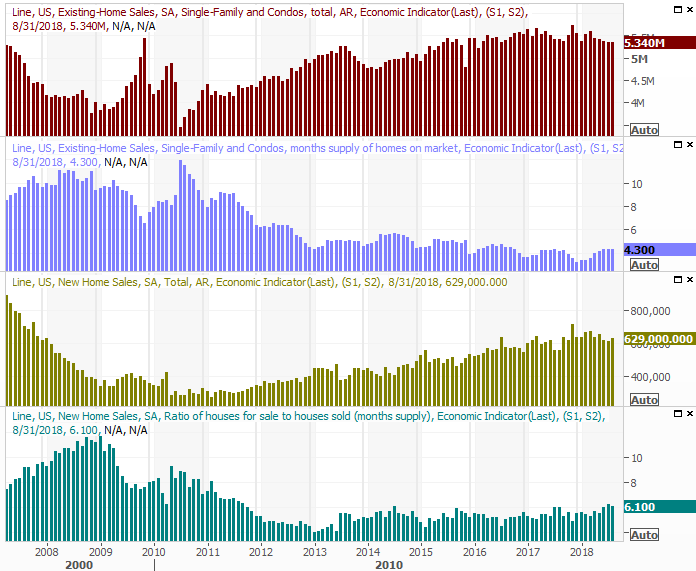
Source: Thomson Reuters
It's possible that rising interest rates are at least part of the headwind home sales are running into now, though it would be wrong to entirely blame the matter on higher borrowing costs. Interest rates remain low by long-term norms.
Index Analysis
Without knowing what came right before it, Friday's big gains would be compelling. Problem is, we do know what came right before it... a severe beat-down that was sure to inspire some sort of bounce. It remains to be seen if the gain was just a temporary reprieve or the beginning of something that will last. Indeed, the S&P 500 as well as the NASDAQ Composite ended last week right at major, pivotal lines in the sand.
That line in the sand is the 200-day moving average line, plotted in green on both daily charts below.
S&P 500 Daily Chart, with Volume
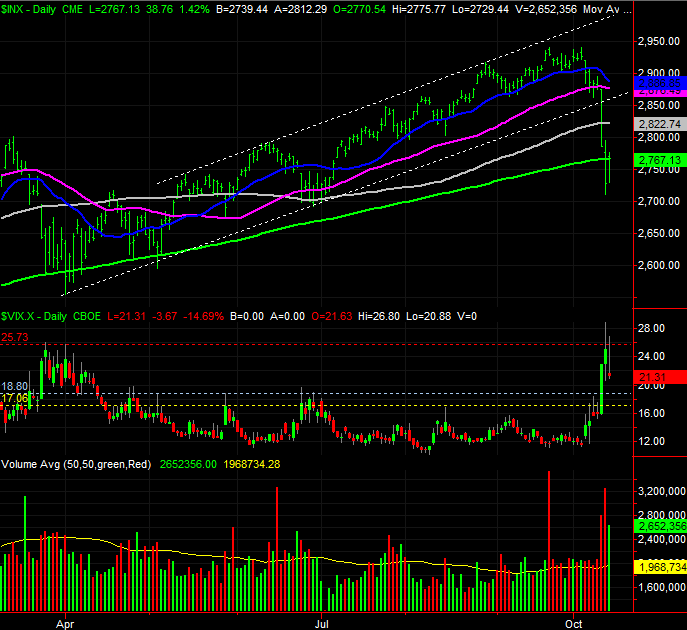
Source: TradeStation
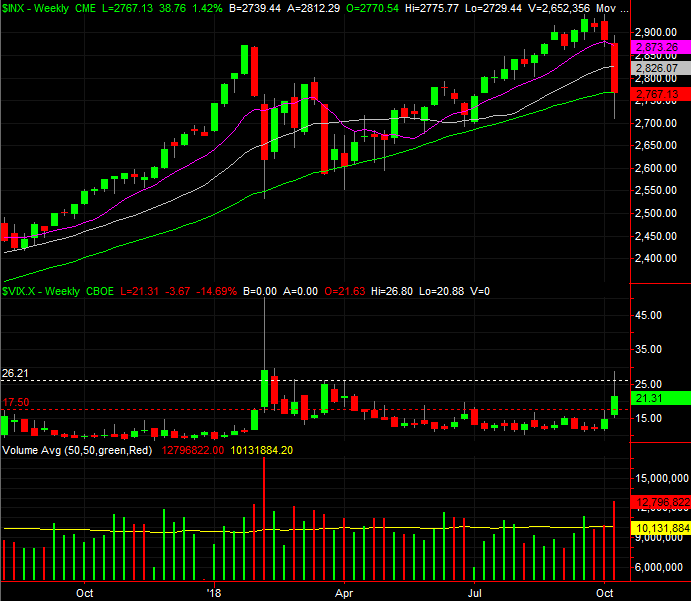
Still, some heavy-duty damage was done. The S&P 500 broker below the lower boundary of a rising trading range that had been guiding it higher since April (framed by white, dashed lines).
There are bullish and bearish clues. Among the bullish ones of course are Friday's bounce-back and the way the VIX appears to have bumped into resistance around 26. Bearish clues include the lack of volume behind Friday's rebound, and as was mentioned, the bulls ultimately drew a line in the sand at the 200-day moving average line, at 2767.
The daily chart of the NASDAQ Composite looks very similar, sporting the same basic bullish and bearish clues. That includes an apparent peak in the VXN.
NASDAQ Composite Daily Chart, with Volume
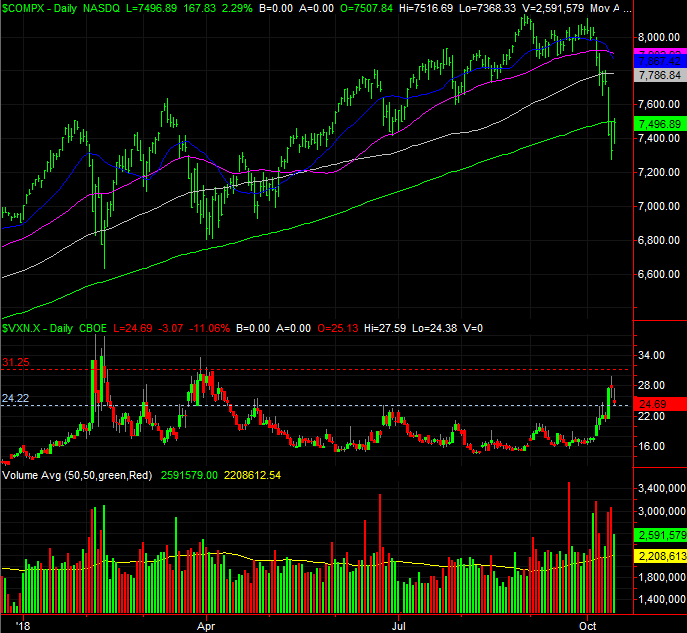
Source: TradeStation
Zooming out to a weekly chart of the S&P 500 puts things in perspective. From this standpoint it becomes clear just how big last week's 4.0% setback was. We've seen worse, though not a lot worse. And, we can't ignore the fact that while the market briefly bounced back from a similar tumble in February, that recovery effort ultimately failed and allowed the S&P 500 to ultimately lead to even more trouble in late March. It did ultimately recover, but it took a while to make that hard landing.
S&P 500 Weekly Chart, with Volume
Source: TradeStation
Putting it all together, what you're left with is a market that's generally poised for a measurable bounce, but also a market that somehow feels due for at least a little more downside... a move below last week's close, and maybe even last week's low (of 2710.51, for the S&P 500). Though the S&P 500 has fallen as much as 7.8% from its recent high to last week's low, the 'normal' correction is closer to a 10% stumble. Ideally, it would even be a little more.
To that end, note that the average October weakness tends to bottom out around the third week of the month, leading into the usual year-end bullishness. This year, based on history, the bottom and pivot would be around October 26th. That gives the market just enough time to edge a little higher, then pull back just a bit more, and then capitulate into a decent recovery move.
That's one possibility anyway. It's less likely, but we do have to acknowledge the lesser possibility that stocks could continue to rally from here... even if at a tepid pace.
Let's wait and see how things take shape from here. Either way, don't be too eager to make a decision. The market hasn't made up its mind yet, and it could be a while before it does.