
Weekly Market Outlook – Moving to the Inflection Point

The market followed through on the previous week’s bullish end at the beginning of last week. But, as has been the case a few times of late, there was no real follow-through. Although technically up for the week, there’s still a subtext of bearishness… like stocks want to dish out that correction they first teased a month ago. Indeed, the bigger technical trend is still bearish, and the path of least resistance is still down.
Of course, Thursday’s lethargy pullback may have just been a little bit of portfolio clean-up headed into the three-day weekend before the end of the holiday-shortened week. We really need to see how the crowd’s feeling on Monday before making a firmer call.
Nevertheless, where we’ll begin the new trading week is where we left off this last one, and we’ve got a few clues to consider. We’ll look at them right after a rundown of last week’s biggest economic news and a preview of what’s coming this week.
Economic Data Analysis
Last week’s big news was of course Thursday’s look at June’s jobs numbers. But, the party started much earlier than that, with Tuesday’s look at home prices. Both the Case-Shiller Home Price Index and the FHFA Home Price Index slumped, albeit it only a little. Still, after wobbling for well over a year now, it’s not a stretch to suggest that home prices have already peaked.
Home Price Index Charts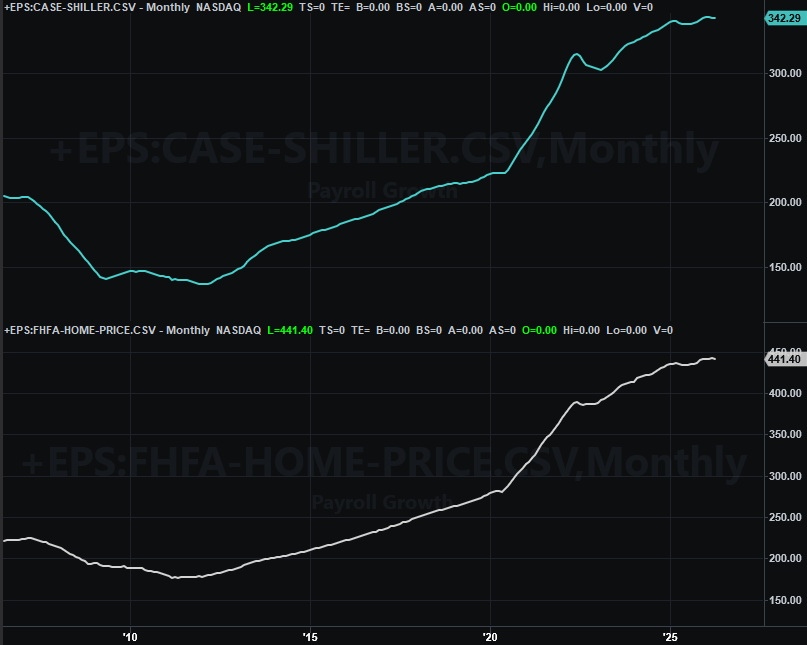
Source: FHFA, Standard & Poor’s, TradeStation
That doesn’t mean they’re going to crash from here. There’s still decent -- although not great -- demand and a very limited supply. Just consider the changing trajectories for both lines on the chart above.
Also on Tuesday we heard from the Conference Board about June’s consumer confidence, rounding out the University of Michigan’s consumer sentiment reading for June posted a week earlier. Like the Michigan number, the Conference Board’s figured ticked a tad higher. Overall confidence remains quite low though, although it doesn’t actually seem to be a problem for the market.
Consumer Sentiment Charts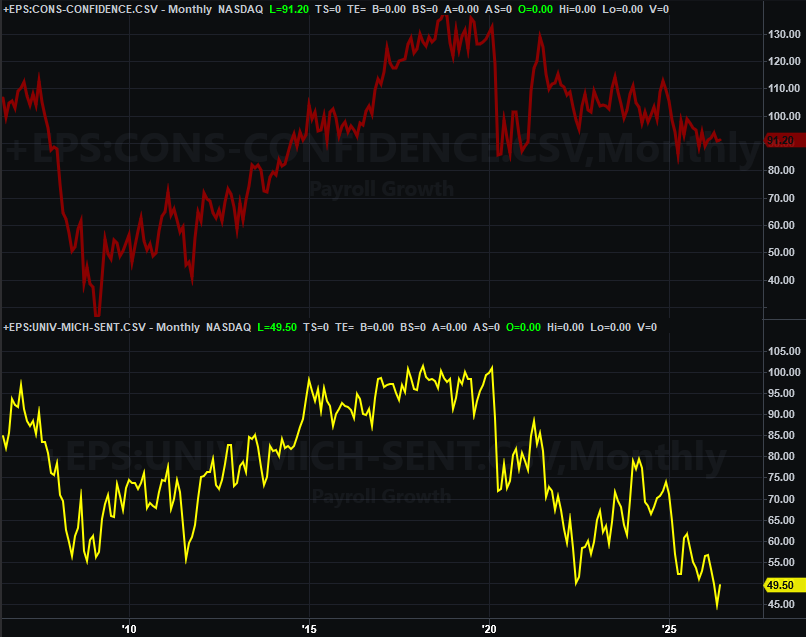
Source: Conference Board, University of Michigan, TradeStation
On Wednesday we heard about the nation’s manufacturing activity from the Institute of Supply Management. It fell just a bit, but it pulled back from a pretty high level. The overall trend and level here is still healthy.
ISM Services, Manufacturing Index Charts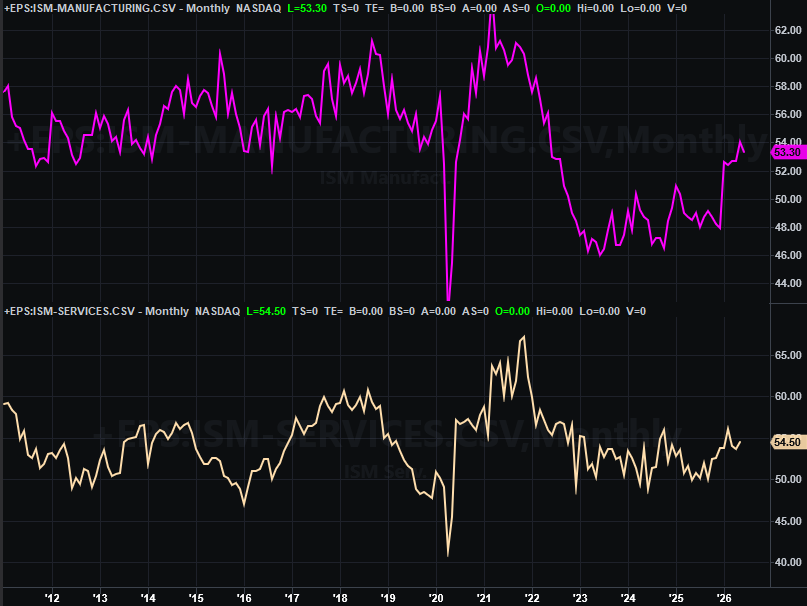
Source: Institute of Supply Management, TradeStation
The ISM’s services index will be updated with June’s number on Monday of this week. As you can see, it too is moving higher, suggesting continued economic expansion.
As for jobs, on Thursday we learned the nation only added a disappointing 57,000 new payrolls last month. Still, job growth has been persistent since 2021, allowing the unemployment rate to edge just a little lower to a multi-month low of 4.2%.
Unemployment Rate, Payroll Growth Charts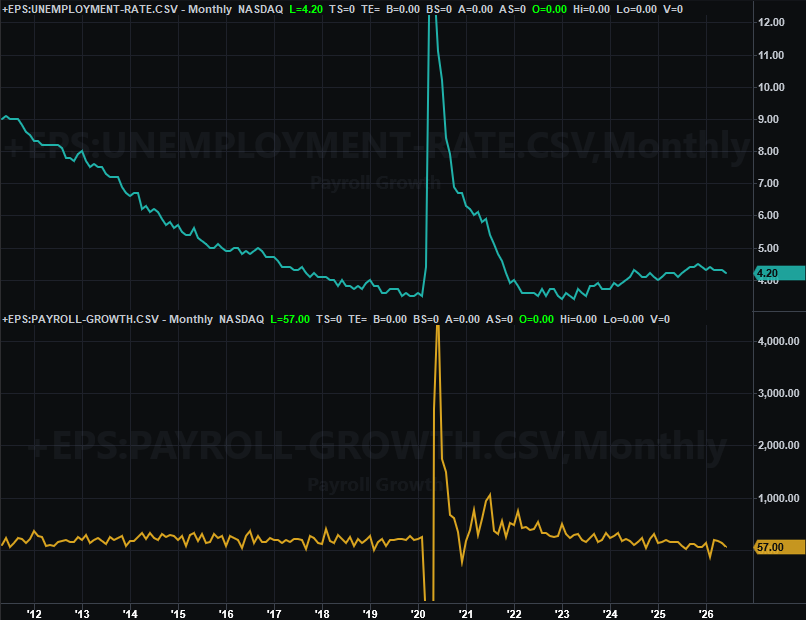
Source: Department of Labor, TradeStation
The total number of people with jobs actually fell, as did the size of the labor force. It’s just that the number of people receiving unemployment benefits fell by even more.
Everything else is on the grid.
Economic Data Report Calendar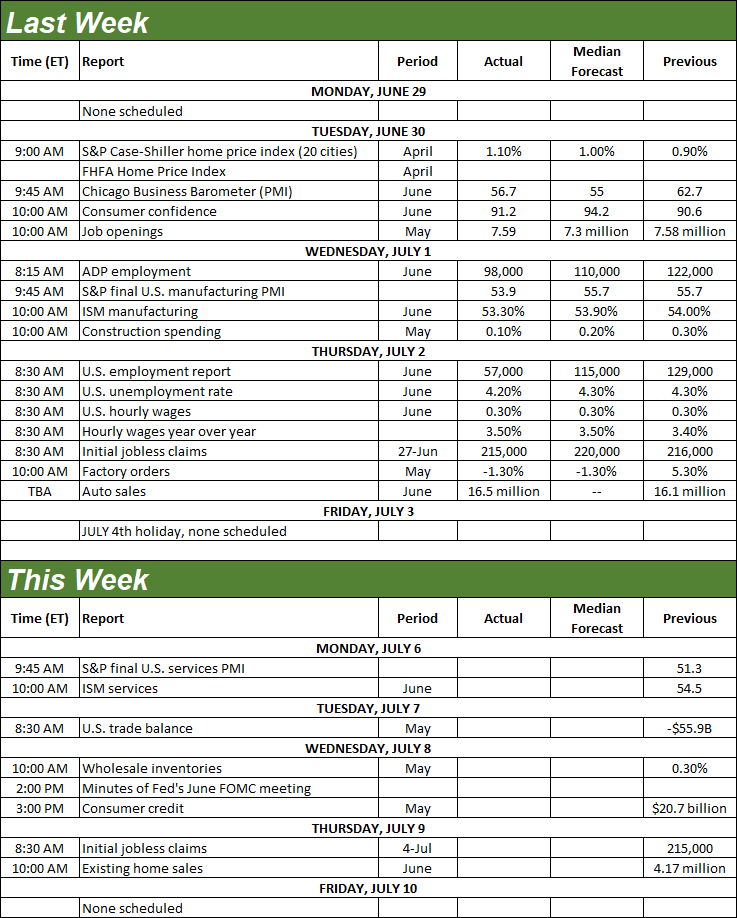
Source: Briefing.com, TradeStation
In addition to Monday’s look at the Institute of Supply Management’s measure of services activity, the only other item of real interest in the lineup for the week ahead is Thursday’s report of existing home sales, from the National Association of Realtors. Don’t look for any real improvement from May’s tepid levels.
Home Sales Charts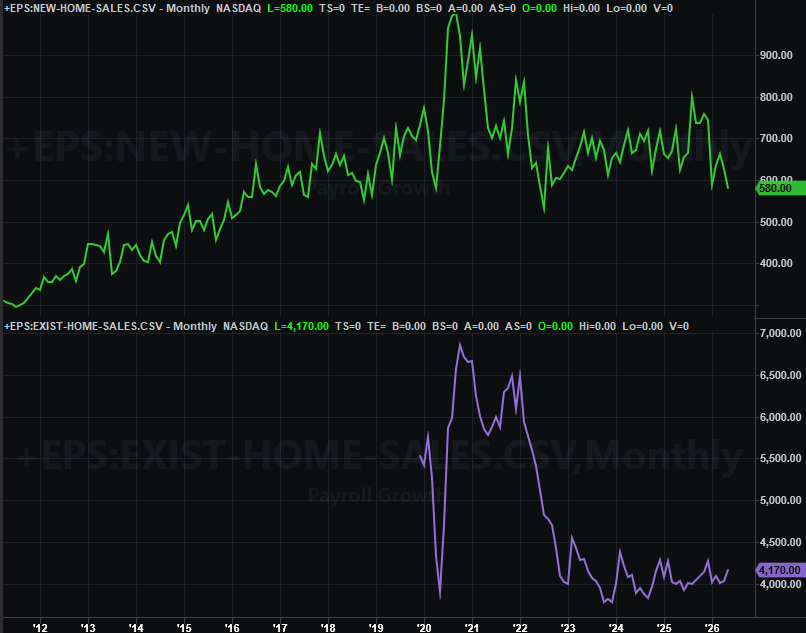
Source: National Association of Realtors, Census Bureau, TradeStation
The Census Bureau won’t be posting last month’s new homes sales data for a couple of weeks. Of course, it’s been even worse than existing home sales, at least partially explaining why home prices are finally starting to ease.
Stock Market Index Analysis
The market actually made some important technical progress last week. Namely, after finding support at what was formerly a technical ceiling (red, dashed, on the chart below/circled in yellow), the S&P 500 ended crossing back above its 50-day (purple) and its 20-day (blue) moving average lines. The problem is, that effort stalled right after it happened, after the index bumped into what’s now been defined as a short-term technical ceiling (purple, dashed)… Thursday’s high (circled in green). As of now, however, the S&P 500 is just back to where it was in mid-May, and seemingly trapped within a narrowing trading range.
S&P 500 Daily Chart, with Volume and VIX 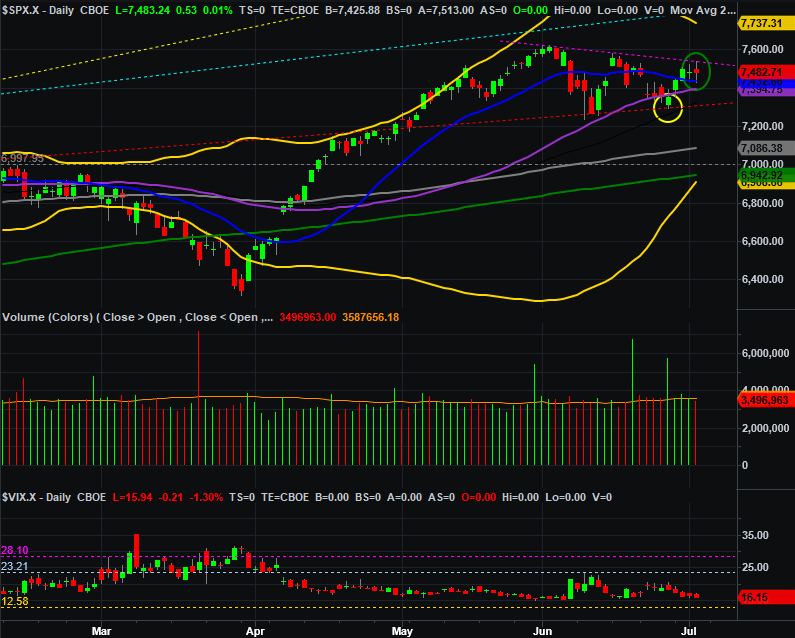
Source: TradeNavigator
The big bullish argument? At least the index appears to be finding technical support at its 20-day moving average line. Mostly though, this all suggests indecision, or a market that lacks conviction. And given the uncertain backdrop following months’ worth of gains, it’s not hard to understand why.
The thing is, the NASDAQ Composite isn’t quite finding the same support. Although it appears to be finding support at 24,969 (green, dashed), the NASDAQ actually slipped back under its 20-day moving average line (blue) by Thursday’s close after bumping into a falling resistance line that connects all the key highs going back to early June.
NASDAQ Composite Daily Chart, with Volume and VXN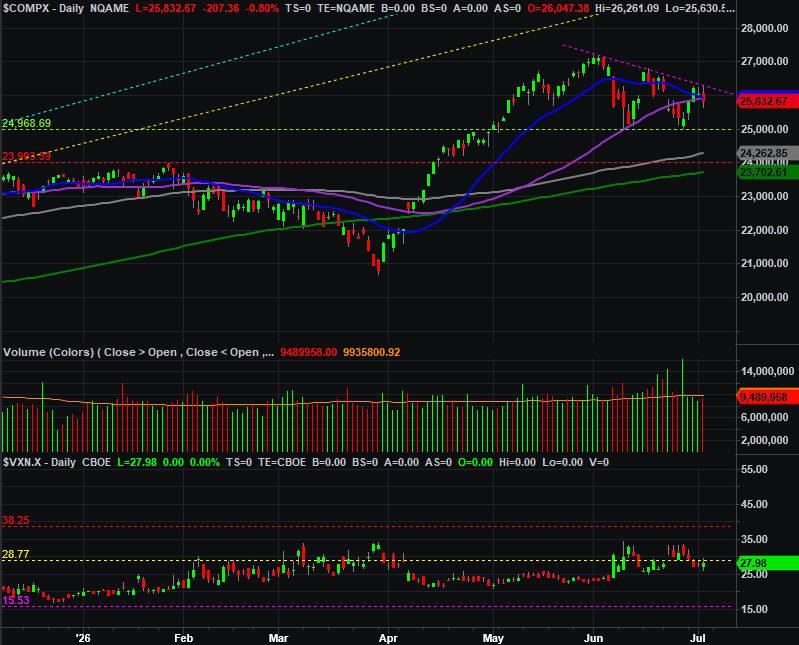
Source: TradeNavigator
Same story here… the composite is only moving sideways, trapped in a narrowing range, but seemingly moving lower. Of course, the real test will be the next encounter with the floor at 24,969.
The weekly chart of the S&P 500 puts things in perspective. This weakness actually started five weeks ago, when the index bumped into a long-established technical ceiling going all the way back to 2023. The pullback from that encounter has been a bit back-and-forth. Nevertheless, the path of least resistance -- and the pattern -- is down, at least enough to test the 100-day moving average line (gray) currently at 7,099.
S&P 500 Weekly Chart, with MACD and VIX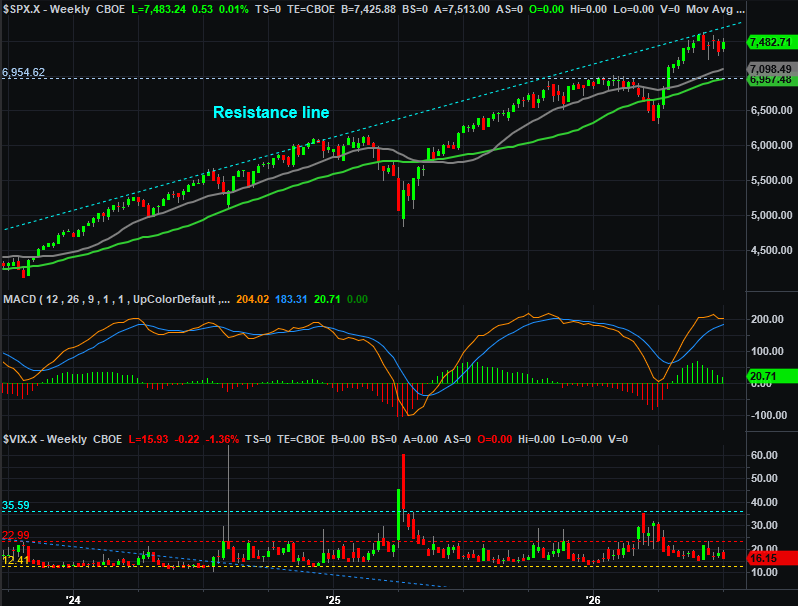
Source: TradeNavigator
Just don’t dig in too deep with any bearish positions. The bulls can clearly push back. And they are. It’s not exactly unusual either. Just go back to early 2025 and early 2026 to see how this can -- and likely will -- work. Once the bearish ball gets rolling, the bulls stop pushing back, and the selling becomes unobstructed. It’s arguable that just making a low beneath the S&P 500’s early-June low around 7,260. At that point, the bulls will probably stop pushing back. This of course this should coincide with the VIX finally breaking above its technical ceiling (red, dashed) at 23.0, and perhaps a bearish MACD crossunder.
Of course, none of this has actually begun happening yet. While still less likely, as it stands right now, the bulls are still technically in a position to rekindle the rally that’s been in place for over a couple of years now.
Your best course of action at this time may simply be doing nothing and letting everyone else show their cards first.