Weekly Market Outlook - Market Disinterest, or Genuine Weakness?
Santa Claus came to Wall Street this year, but he didn't show up with a sack full of presents... it was only half full. The S&P 500 logged a lackluster 1.8% recovery from Monday's low following a lousy opening to the week, but that still left the index down just a hair for the holiday-shortened week. Mostly, traders were disinterested.
It's noteworthy, however, that the indices found technical support right where they needed to the most in order to keep the rally alive.
We'll look at that matter in some detail below. First, let's recap last week's economic announcements and then preview what's in the cards for this week.
Economic Data Analysis
Economists knew recent trouble would take the wind out of consumers' confidence sails. But, they didn't know by how much. It was a lot. Not only did the Conference Board dial back November's first figure of 96.1 to 92.9, this month's reading of 88.6 was the lowest level since April. The Michigan Sentiment Index edged a little higher, to 80.7. That's actually up from November's reading, though still concerningly low. Consumers aren't confident about their situation tend not to buy stocks, or even discretionary items.
Consumer Sentiment Charts
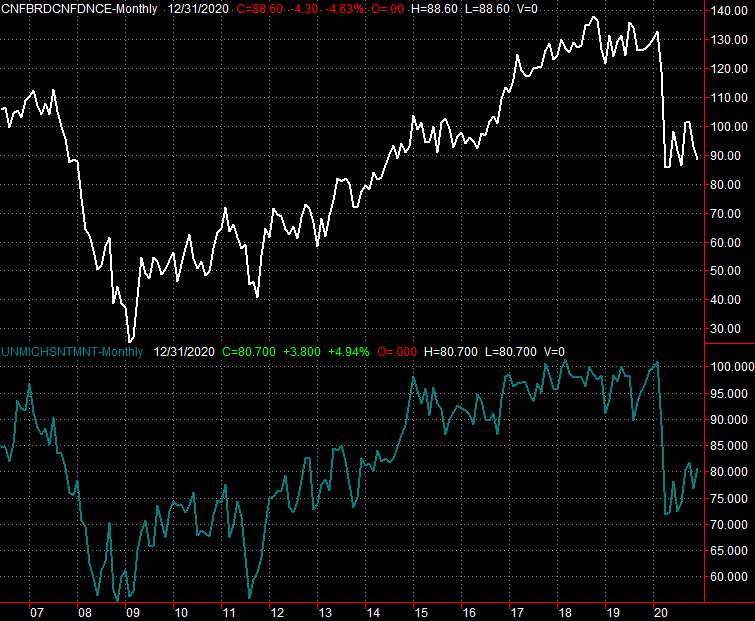
Source: Conference Board, Univ. of Michigan, TradeStation
This waning sentiment is reflected in November's tally of new home sales, which slipped from October's 945,000 to an annualized pace of 841,000. (Existing home sales fall last month as well.) Just bear in mind that pullback was from an extreme surge seem on August and September. In the grand scheme of things, that's still quit high.
New Home Sales Charts
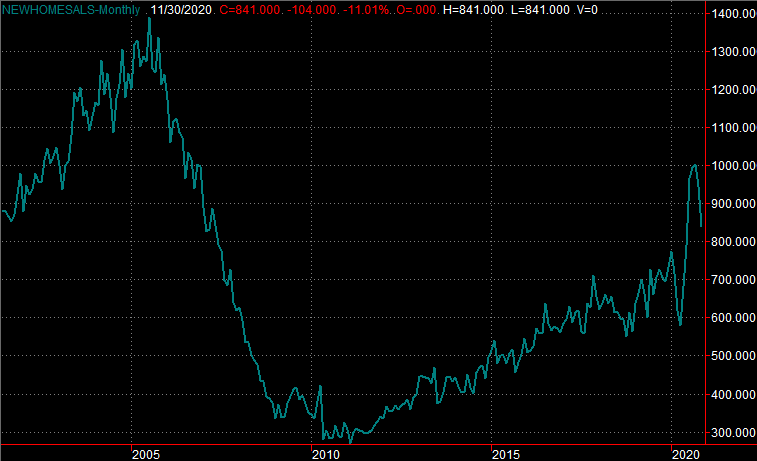
Source: Census Bureau, TradeStation
Home prices are holding up as well. In fact, they're continuing to edge higher. The FHFA House Price Index level for October grew 1.5%. That's a 10.2% year over year improvement.
FHFA and Case-Shiller Home Price Charts

Source: Standard & Poor's, FHFA, TradeStation
The Case-Shiller figure is coming this week, and like its counterpart, is expected to move forward as well. Just bear in mind that both of these home price numbers are for October, and much has changed in the meantime.
Everything else is on the grid.
Economic Report Calendar
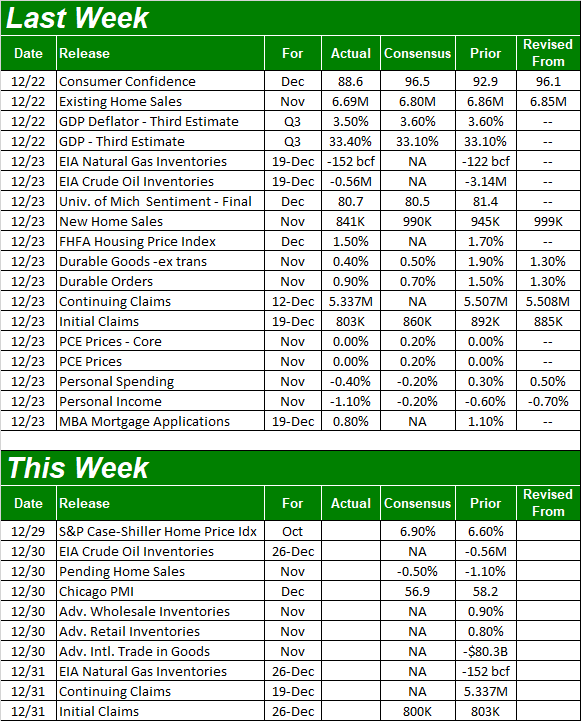
Source: Briefing.com
There's nothing else of real interest coming this week besides the Case-Shiller number, so there are no other charts worth previewing here.
Stock Market Index Analysis
We're kicking things off this week with a close-up view of the S&P 500's daily chart, as that's the best way to illustrate last week's most important detail. That is, the bears may have pushed back against an overextended market, but the bulls drew a line in the sand where they needed to the most. The 20-day moving average line (plotted in blue) ultimately kept the market propped up, serving as a floor from which the bulls were able to push up and off of.
S&P 500 Daily Chart, with VIX and Volume
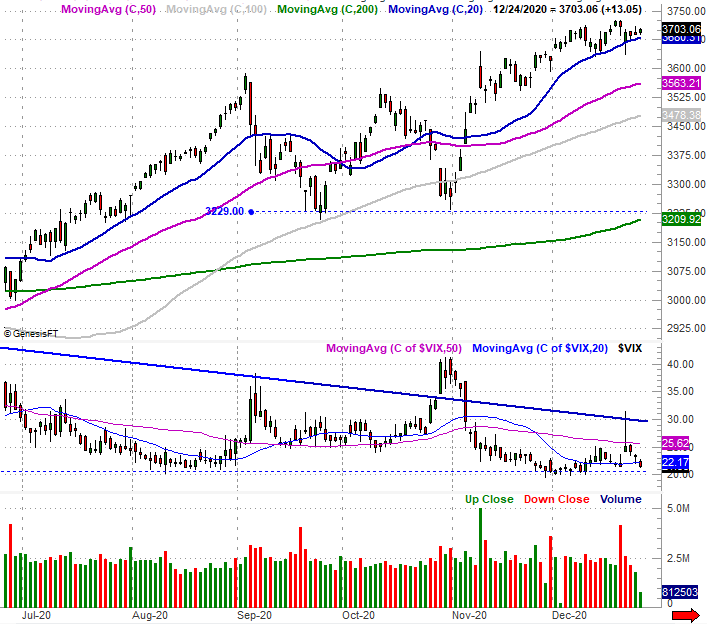
Source: TradeNavigator
We'll zoom out to the weekly chart of the S&P 500 just to add some perspective. As has been noted several times already, the 69% rally from March's low is incredible, but followed an incredible selloff. Even so, the index is well overextended. The S&P 500 is now 14% above its 200-day moving average line (green). It only got 11% above the 200-day line in February, which is about the average extension above that long-term moving average line.
S&P 500 Weekly Chart, with VIX and MACD

Source: TradeNavigator
Also note the VIX continues to find a floor at 21.0. There's room -- theoretically -- for it to slide all the way back to 10.0, but 21.0 seems to be where the bulls are drawing their line in the sand right now.
The NASDAQ Composite's weekly chart looks similar, but there's one glaring difference... the composite logged a gain last week, tiptoeing further into record-high territory. The NASDAQ is now up 93% from March's low, and is now up more than 21% from its 200-day moving average line (green).
NASDAQ Weekly Chart, with VXN and MACD
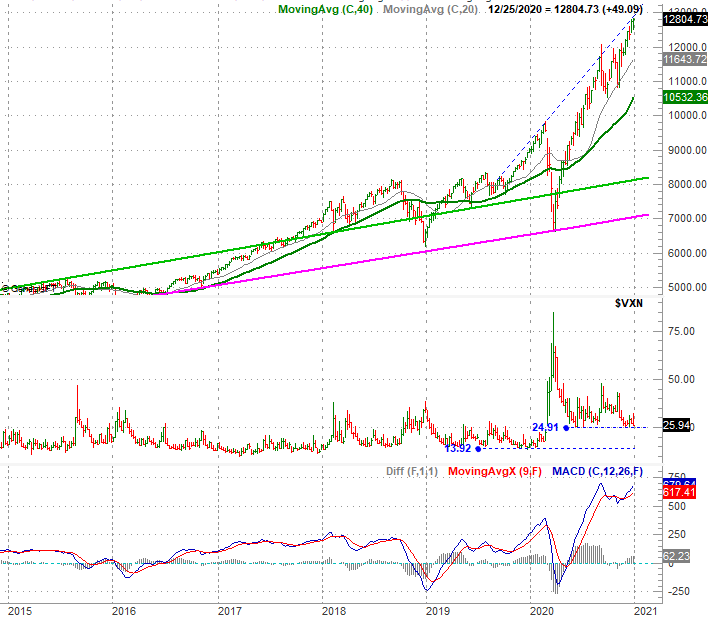
Source: TradeNavigator
Normally leadership from the NASDAQ Composite would be a good thing, as the NASDAQ tends to lead the overall market higher and lower. There are two red flags subtly waving here, however.
One of those red flags is, like S&P 500's VIX, the NASDAQ's VXN isn't moving any lower even though the NASDAQ continues to edge higher. The other is, the NASDAQ's leadership isn't being fueled by the biggest and most popular NASDAQ stocks.
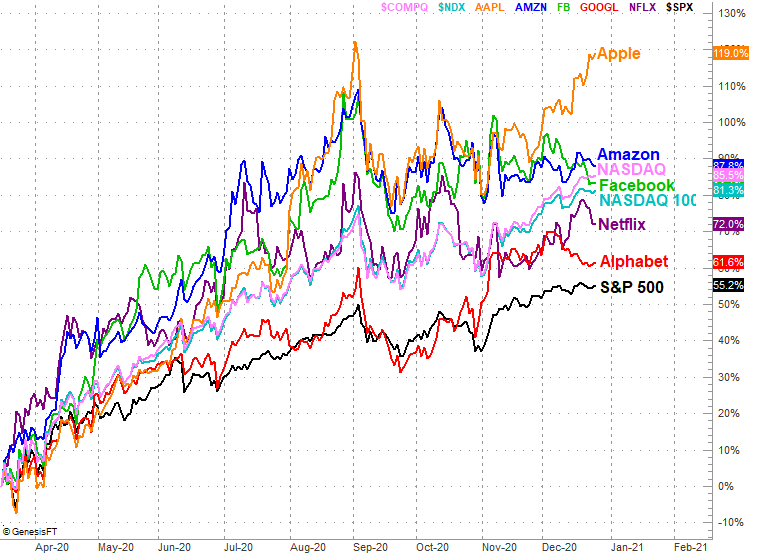
Take a look. Most of the FANG stocks (Apple is the only real exception) are peeling back from their August and November highs, underperforming the NASDAQ. In fact, the NASDAQ 100 is underperforming the composite, telling is the largest of the large caps aren't driving the move. This is coming from smaller companies. That's fine, but this is not the leadership mix that keeps rallies in motion.
FANG Stock Performance Comparison
Source: TradeNavigator
This is anything but ironclad assurance that a pullback or correction is imminent. This is a bullish -- even if modestly -- time of year anyway. But, valuations are uncomfortably high, we're about to transition into a new presidency, consumer sentiment turned (very) lousy, the pandemic is still uncontrolled, and we're plain-old overdue for some profit-taking. If a correction isn't coming this week, it's likely coming soon.
To this end, the lines in the sand we're watching are the S&P 500's 20-day line at 3681, and then the NASDAQ Composite's 100-day moving average line at 11,600. Both are prospective technical support, but if they fail to keep the market propped up, that could actually encourage more selling. In the same vein, the VXN and the VIX both have their own technical ceilings to grapple with.
S&P 500, NASDAQ Composite Volatility Index Charts
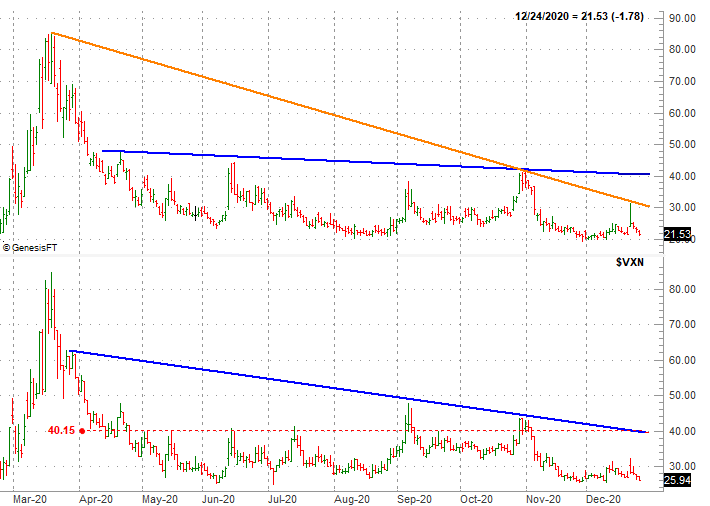
Source: TradeNavigator
If any of that resistance fails to hold the VIX or VXN down, that's another red flag.
It's too soon to say if last week's lethargy was genuine weakness. Interest is always pretty low around the holidays, and that won't change much this week. But, we certainly can't rule out the possibility that we're starting to see signs of legitimate doubt about valuations and the rally's future.