Weekly Market Outlook - Last Week's Strong Finish Still Isn't Enough to Restart the Rally
On the brink of disaster, stocks mustered a great showing when they needed to the most. Thanks to Friday's 3.0% jump, the S&P 500 rallied 6.4% for the shortened trading week. It's certainly a good start to a rebound, but don't count your chickens just yet. Even with the big move, the market is only back to where it was three weeks ago, before the plunge from two weeks ago. We can chalk a bug chunk of the gain up to sheer volatility.
That doesn't preclude more upside from here. Just keep in mind we've see these sorts of moves before in just the past few weeks. Not only did none of them really follow through, all of them ultimately ended up with even lower lows.
We'll show you a clear illustration of this reality below. First, however, let's run through last week's economic reports and preview what's in the cards for this week.
Economic Data Analysis
There wasn't a whole lot of data to process from last week, but we rounded out the real estate picture with reports on last month's sales of new and existing homes. They were... not bad, which is a win we needed. Sales of existing homes only slipped from 5.6 million to the expected 5.4 million, while in a surprise, sales of new houses jumped from April's pace of 629,000 to 696,000, trouncing estimates for a dip to 595,000. Not that other real estate data isn't showing signs of weakness, at least activity is faring better than expected. Still, the bigger trend is a bit troubling.
New, Existing Home Sales Charts
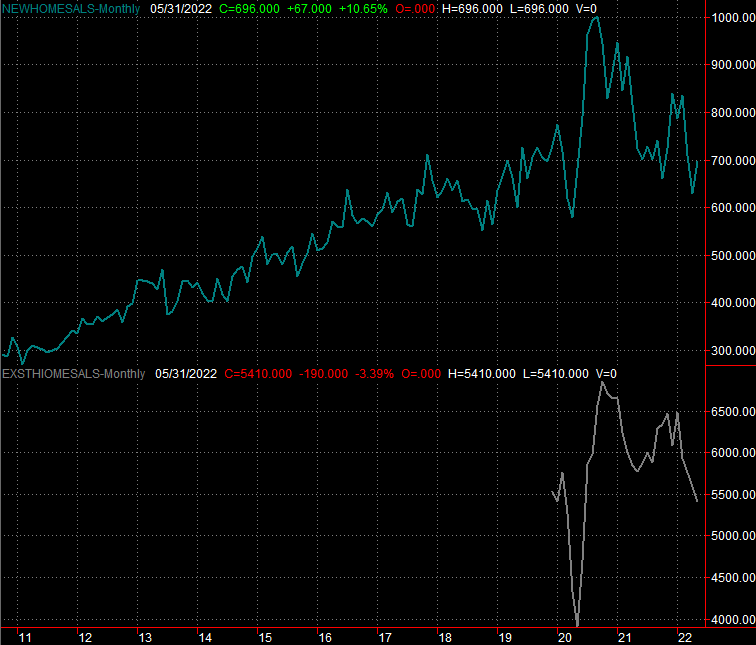
Source: Census Bureau, National Association of Realtors, TradeStation
Everything else is on the grid.
Economic Calendar
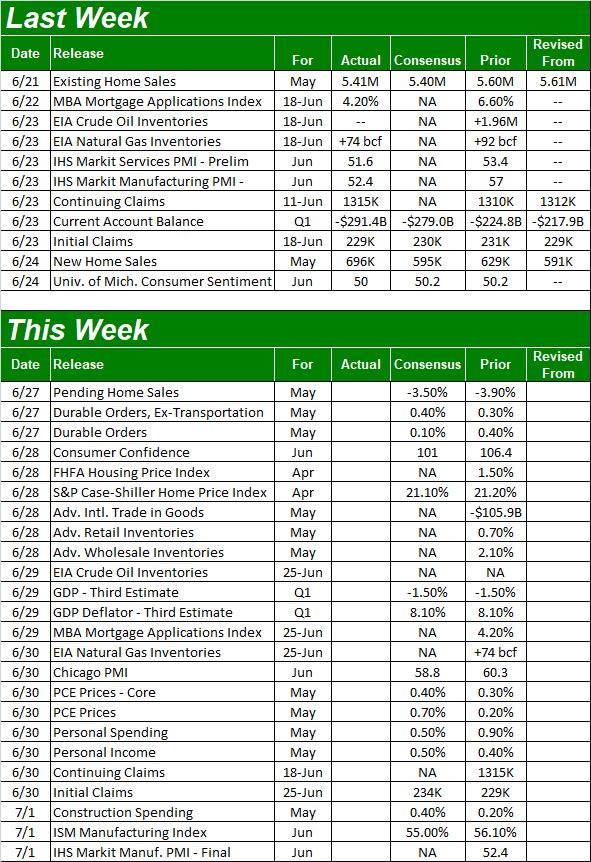
Source: Briefing.com
We'll get the final piece of the current real estate puzzle this week, with the S&P Case-Shiller Index as well as the FHFA's Housing Price Index coming on Tuesday.... although the figures will only be for April; much has changed in the meantime. Even so, strong price increases are still expected despite the weakness that started to take shape well before April began.
Home Price Charts
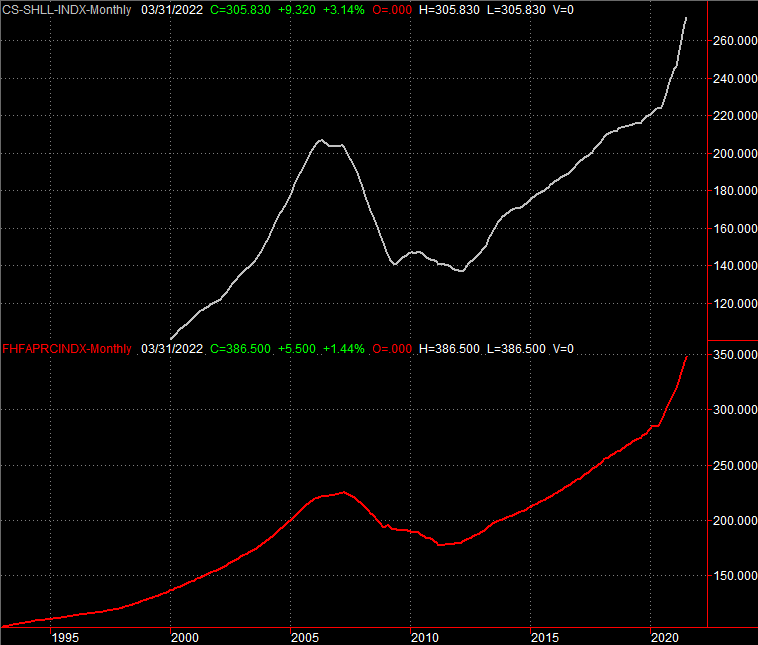
Source: Standard & Poor's, FHFA, TradeStation
We'll also get June's consumer confidence figure from the Conference Board on Tuesday Unsurprisingly, forecasters believe it will fall from May's reading of 106.4 to a multi-month low of 101.0; most of any progress made since we started coming out of the worst of the pandemic has now been given back. Meanwhile, last week's final update of June's University of Michigan Sentiment Index pulled the index deeper into multi-year-low territory. This isn't good, at all.
Consumer Sentiment Charts
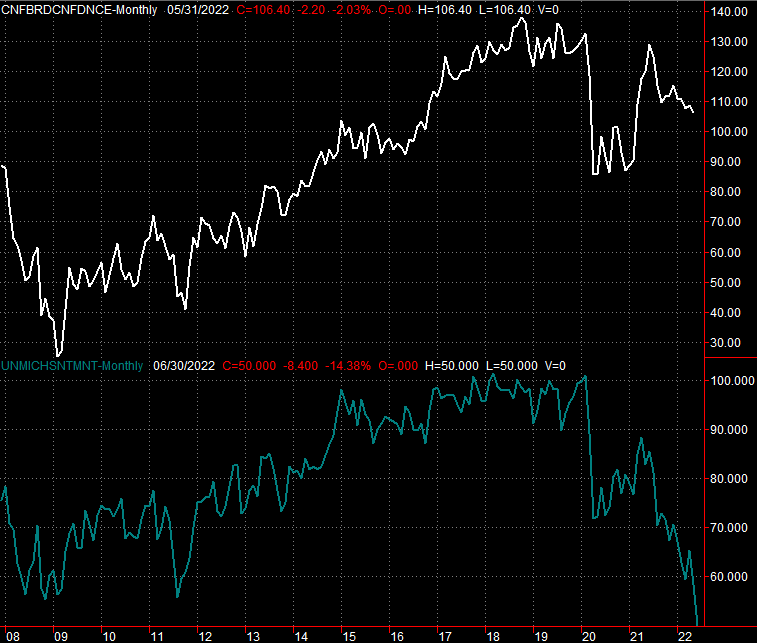
Source: Conference Board, University of Michigan, TradeStation
On Friday we'll get half of the regular monthly data from the Institute of Supply Management... the manufacturing index. Economists expect another dip following May's slight uptick, though it's still set to hold above the critical 50 mark that delineates growth and contraction.
Institute of Supply Management Manufacturing and Service Index Charts
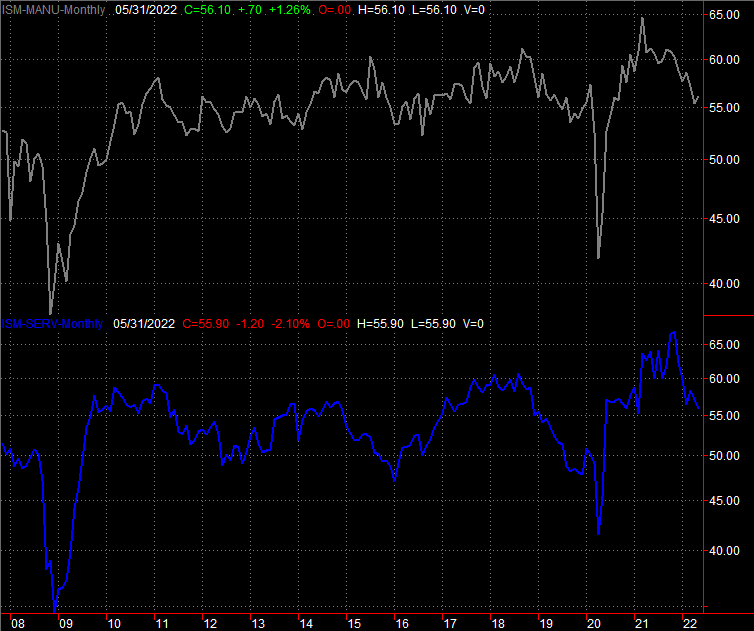
Source: Institute of Supply Management, TradeStation
The supply version of the ISM index will be posted in the coming week, though notice that it too is cooling.
Also look for the third estimate of Q1's GDP growth rate on Wednesday, though economists aren't looking for the second guess of a 1.5% contraction to change.
Stock Market Index Analysis
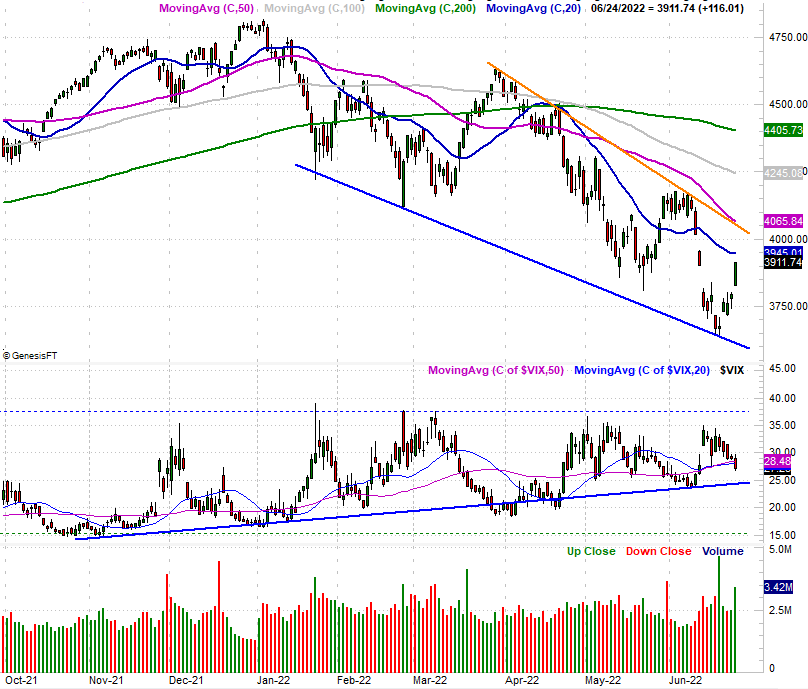
Let's just cut to the chase - last week's bounce might have merely been the result of overzealous selling from the week before. As the weekly chart of the S&P 500 below illustrates, the index kissed a support line (blue) that connects most of the key lows made since this selloff began back in January. Also note that each of those lows was ultimately followed by an even-lower low. This one might be as well, when all is said and done.
S&P 500 Weekly Chart, with VIX and Volume
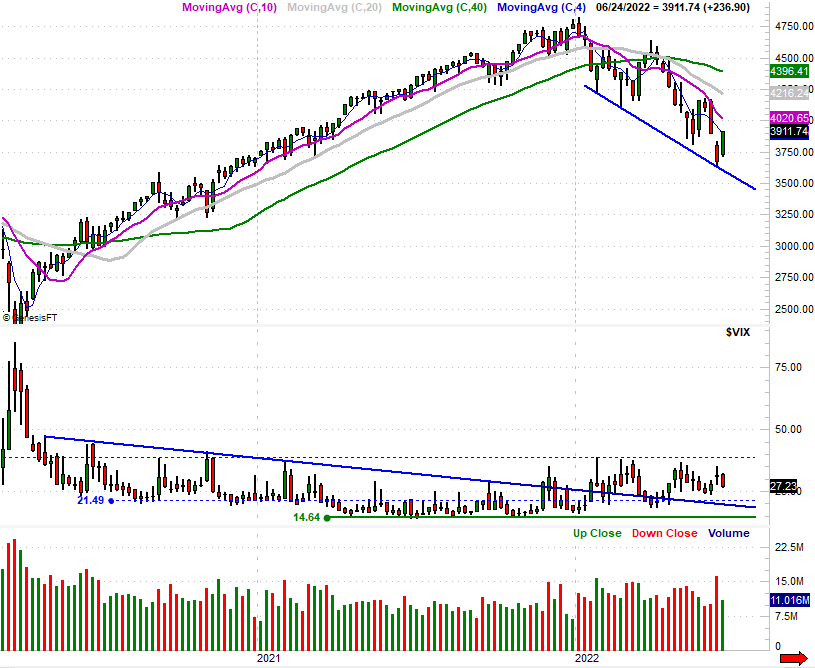
Source: TradeNavigator
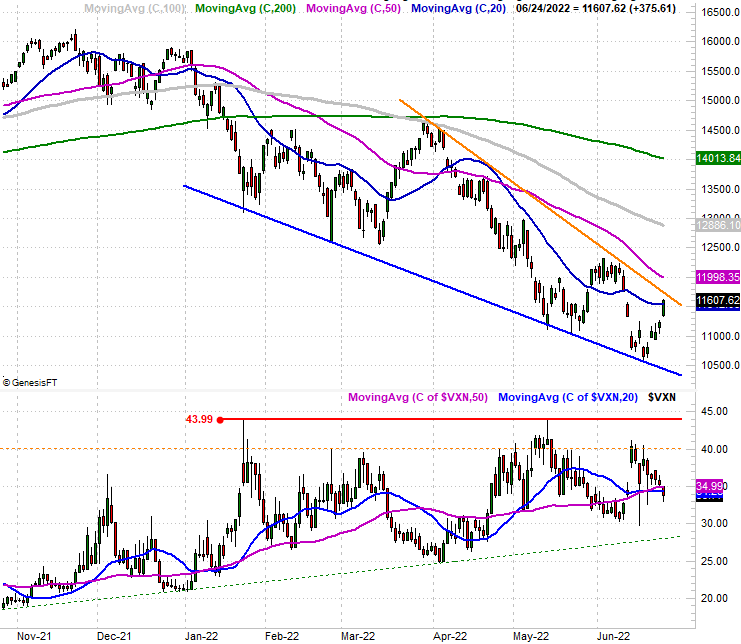
Same story for the NASDAQ Composite, though arguably with even more precise structure. That is to say, the NASDAQ's low from two weeks back connects all the major lows made since late January (again potted in blue). This bounce could still easily run into the headwind all the other rebound efforts bumped into.
NASDAQ Composite Weekly Chart, with VXN
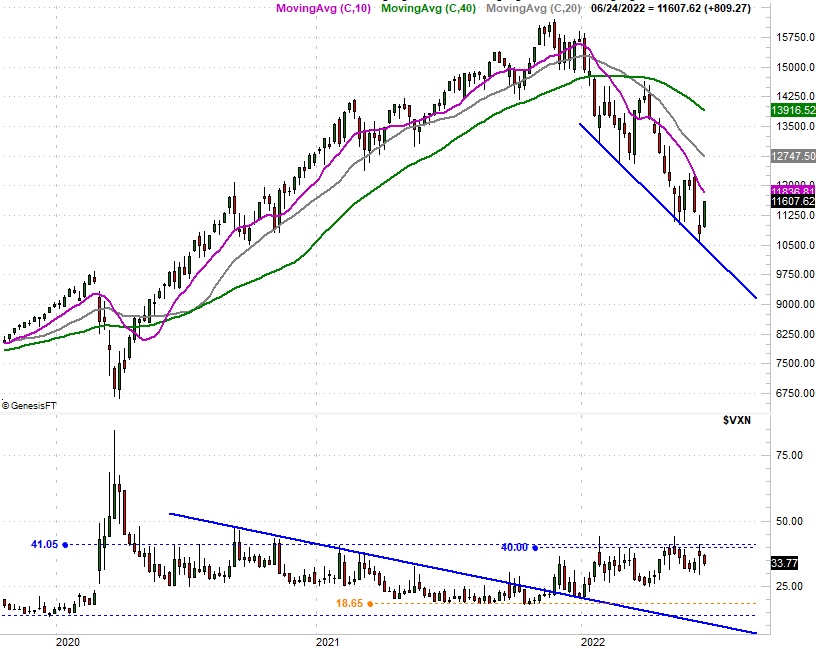
Source: TradeNavigator
Stating the obvious doesn't help us much. Last week's buying might find a little follow-through this week to carry the market a bit higher. Or, perhaps last week's surge ended the week already out of gas, setting up some immediate downside to get things going lower right out of the gate this week. Of course, one headline could immediately alter the market's direction here as well, so trading remains a day-to-day, hour-by-hour affair until further notice.
Fortunately, the daily charts of both aforementioned indexes show us where the most important lines in the sand are that will flag the next real breakout or warn of the next leg lower.
For the S&P 500, that line in the sand is currently at 4060, though falling fast. This line connects all the key highs since March's peak, and is also where the 50-day moving average line (purple) currently rests.
S&P 500 Daily Chart, with VIX and Volume
Source: TradeNavigator
The NASDAQ's big ceiling here is somewhere in the area of 11,750 and 11,998, the latter of which is where its 50-day moving average line currently sits. That's within striking distance thanks to Friday's gain, but like the S&P 500, the NASDAQ Composite now has two bullish gaps in the rearview mirror that may be pressured to be filled in.
NASDAQ Composite Daily Chart, with VXN
Source: TradeNavigator
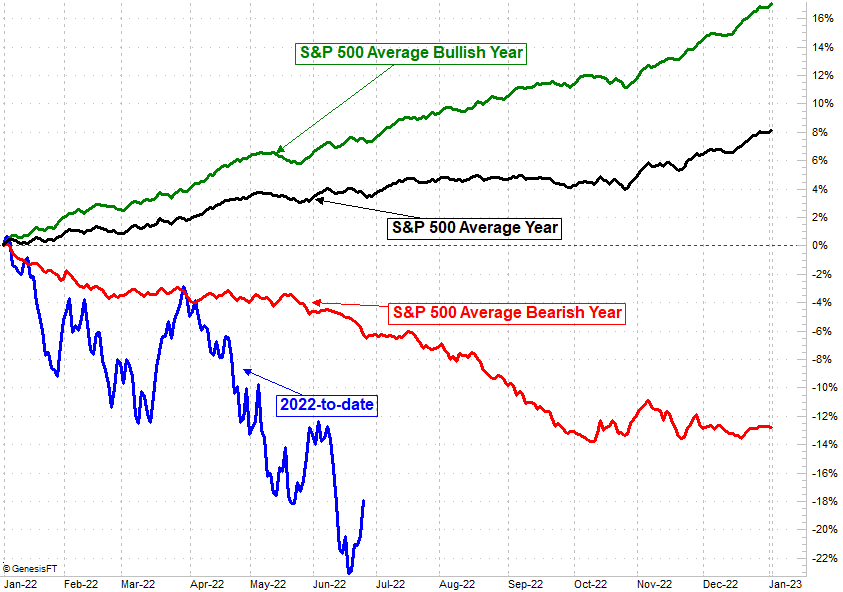
With all of that being said, perhaps the thing working against the market the most here isn't a bigger-picture downtrend and its short-term overbought condition, but the calendar.
We looked at this a week ago but it merits an updated look now. That's the chart that shows the S&P 500's typical cumulative full-year progress, with the addition of its day-by-day results in bearish years as well as in bullish years. It's a slow time of year -- that much you likely know -- and still slightly bullish when we're in a bull market. If we're destined to end the year with a loss though, stocks generally do very poorly between June and September.
S&P 500 Full-Year Cumulative Performance Comparison Chart
Source: TradeNavigator
Yes, this year's selloff goes well beyond the normal scope of the summertime selloff in a bear market. Just bear in mind that stocks started the year much higher than they normally would thanks to last year's red-hot rally. Taking that big runup out of the equation, the S&P 500 would more or less be down about as much as it usually at this point in the year when the index is headed for a full-year loss.
The smart-money move here is doing nothing... at least for the time being. Most people are relatively rattled by the recent selloff and now economic uncertainty that's not being particularly well addressed. That means the market could (quite literally) do anything and go anywhere from here. Just keep everything on a short leash.