Weekly Market Outlook - May 31, 2016
If anything, last week's economic and earnings news was on the weak side. That didn't stop the bulls from going on a rampage though. The S&P 500 (SPX) (SPY) gained a solid 2.5% last week, carrying the index to mew multi-week highs. The BigTrends TrendScore ended the week with a score of 93.5 (out of 100). That's about as bullish as it gets.
Can it last? That remains to be seen. The argument that there's just not much valuation room for more upside still makes sense, and we don't have a key buy confirmation signal yet. The bulls are clearly winning the war right now though, whether it makes sense or not.
We'll dissect the market from both sides of the table, as always. First though, let's do a quick review of last week's and this week's economic news, which is ultimately steering the ship.
Economic Data
Last week wasn't a terribly busy one in terms of economic news, but much of what little we got was rather hard hitting.
Perhaps the biggest news was the revised GDP growth data for Q1. There's still one more revision in the cards, so take Friday's 0.8% increase with a grain of salt (versus a prior reading of 0.5%). But, odds are good we won't see too much change from this week's reasonably healthy reading the next time around.
GDP Chart
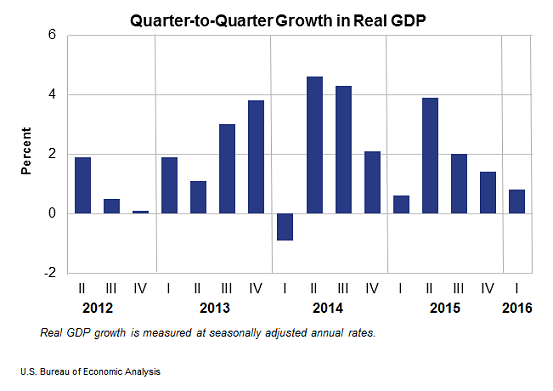
Source: U.S. Bureau of Economic Analysis
It was also huge - and bullish - week for real estate. The FHFA Housing Price Index grew 0.7% versus expectations of only a 0.5% increase, and new-home sales soared to a pace of 619,000 units versus expectations of 521,000. That's a multi-year high reading, and refanned the waning flames of real estate enthusiasm.
New Home Sale, Existing Home Sales, Inventory Chart
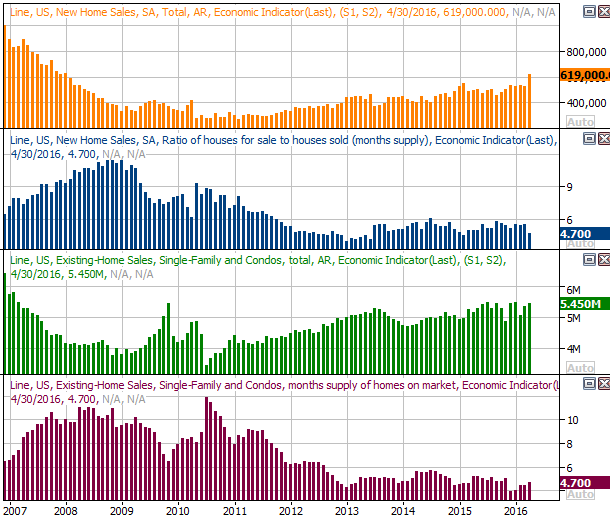
Source: Thomson Reuters
FHFA Housing Price, Case-Shiller Index Chart
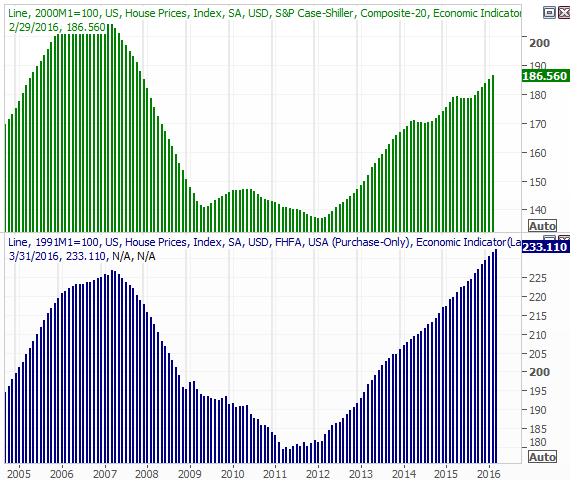
Source: Thomson Reuters
Everything else is on the following grid:
Economic Calendar
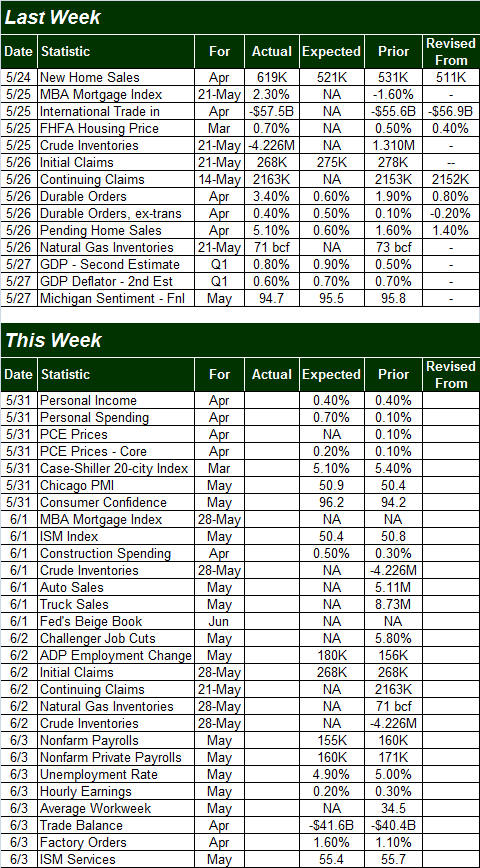
Source: Briefing.com
This shortened trading week is going to be a heck of a lot busier, though not all of the news in the lineup is game-changing.
Among the more important items will be Tuesday's update of the ISM Index, and Friday's report of the ISM Services Index. Both are expected to come in above the critical 50 threshold again, but both are also expected to fall a bit from March's readings. Neither has been on an overly impressive trend lately.
ISM Index Chart
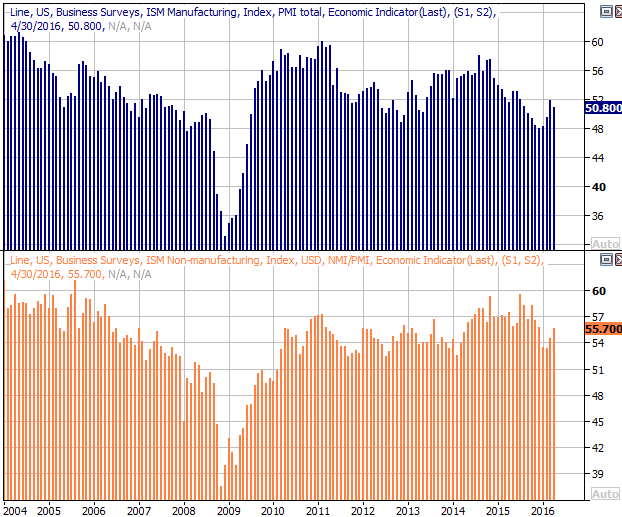
Source: Thomson Reuters
Notice we'll also hear April's consumer confidence reading on Tuesday. Economists are looking for a decent increase for last month.
Consumer Confidence Chart
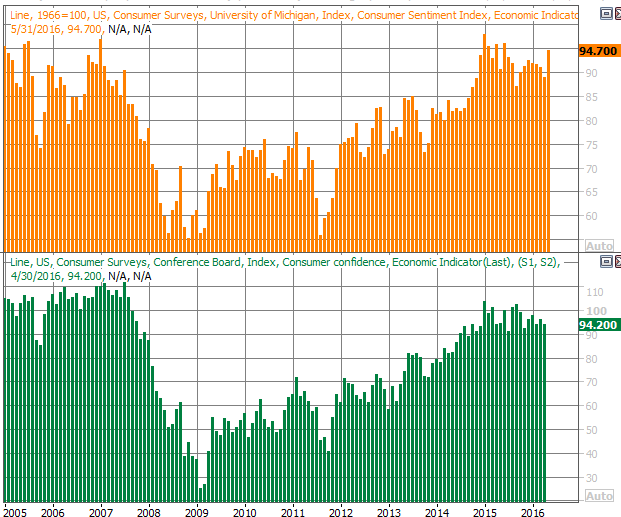
Source: Thomson Reuters
The proverbial Big Kahuna, of course, is Friday's unemployment rate and payroll growth report. The pros say we're going to add 155k new jobs for last month, which should be enough to ratchet down the unemployment rate from 5.0% to 4.9%.
Unemployment Rate, Payroll Growth Chart
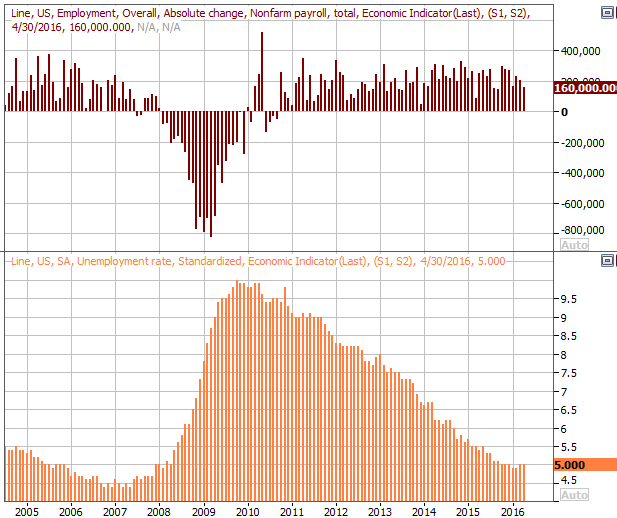
Source: Thomson Reuters
Stock Market Index Analysis
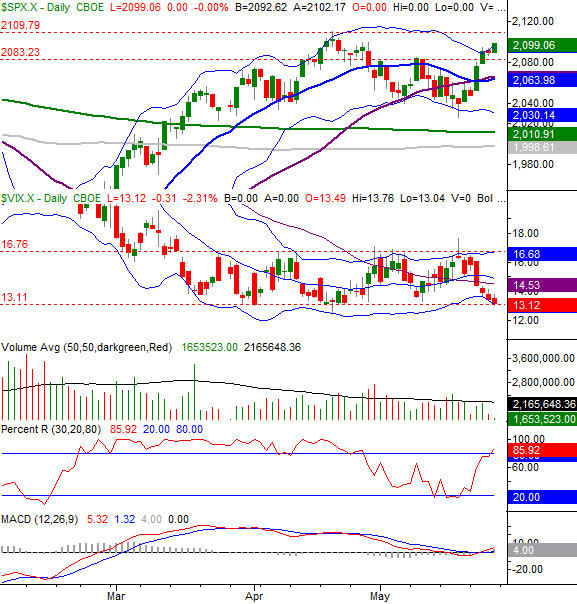
Credit has to be given where it's due. Two weeks ago, the market ended the week on a bearish foot, and knocking on the door of a major support level. The bulls took charge early last week though - at the eleventh hour - to give us the best weekly gain since early March. We're now back above the upper Bollinger band. Yet, we're not back above the pivotal line in the sand. We have a bullish MACD signal, but we don't yet have a critical Percent R confirmation of bullishness. The CBOE Volatility Index (VIX) (VXX) is trending lower, which is bullish, but for the VIX to continue moving meaningfully lower it will have to move to new multi-year lows.
It's no minor conundrum.
Let's just start with a look at the daily chart, which proverbially accentuates the positive. In this timeframe we can see the S&P 500 is now back above the 20-day (blue) and 50-day (purple) moving average lines - and is no above all of its key moving averages - making it clear the undertow is bullish in all timeframes. The bullish MACD crossover confirms this idea. We've even got a Percent R line back above the 80 threshold. Normally this indicates an overbought chart, and it still might to do in our current case for the S&P 500. If the Percent R gets AND STAYS above the 80 threshold though, and survives a test, it will be a bullish clue not unlike the way it was from late February through late April.
S&P 500 & VIX Daily Chart
Chart created with TradeStation
One could also argue that last week's gains were tainted by the fact that they unfurled on minimal volume, meaning this may not be the majority opinion. The counter-argument is, as little bullish volume as we saw, there was still more buying volume than bearish volume.
The volume picture isn't the biggest problem for the S&P 500 right now, however. If anything, the VIX is the most concerning tool in our toolbox right now.
The weekly chart of the S&P 500 and the VIX puts things in a better perspective than the daily chart does. Take a look. The 13.0 mark (dashed) has been a huge floor since October, and the 11.85 level (solid) has been an absolute floor for years now. The VIX is already near that absolute low.
S&P 500 & VIX Weekly Chart
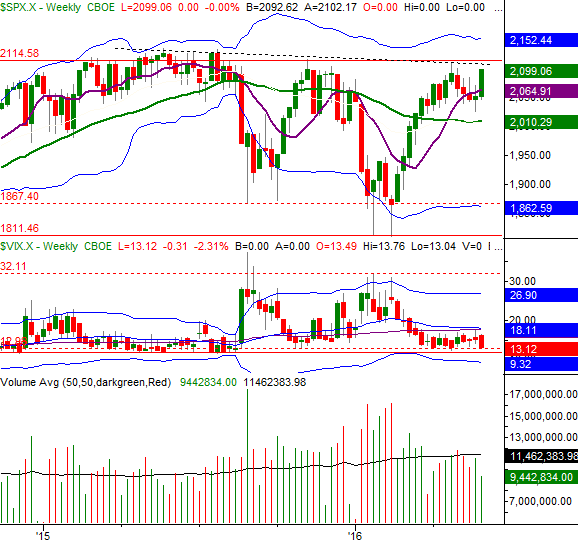
Chart created with TradeStation
That's not to say it's impossible for the VIX to keep moving lower. It is to say it will be tough for the VIX to do so though, and with the S&P 500 already within reach of testing a couple of different major technical ceilings around 2110, it's going to take a Herculean effort to get the market over this hump.
If it should happen though, the market could go on a trade-worthy breakout ride. Even then though, it won't be a huge or prolonged rally. And, it's all a very big "if." June isn't exactly known for being a great month for stocks.
Just for the record, here's a look at the weekly chart of the NASDAQ Composite. It too is bumping into a falling resistance line (dashed) that extends back to the late-2016 highs. You can also see the Nasdaq Volatility Index (VXN) is near an absolute floor.
NASDAQ Composite Weekly Chart
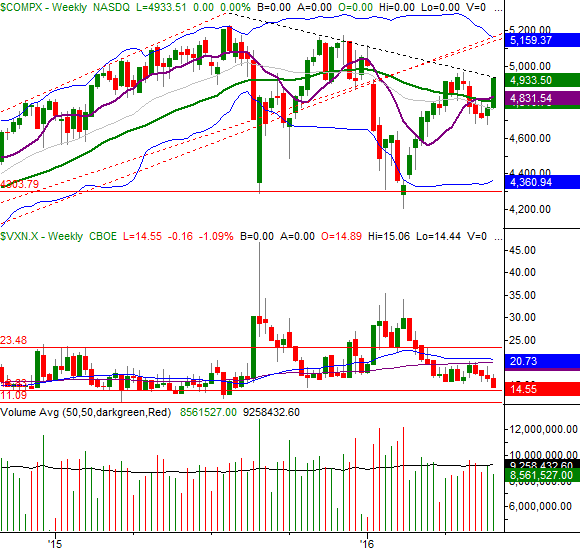
Chart created with TradeStation
Should the bulls manage to stage a breakout, the recently-lagging NASDAQ poses more upside opportunity than the S&P 500 does. The NASDAQ won't likely bump into an established ceiling until the 5160 area, if it takes off. Again though, these are big ifs.
Trade Well,
Price Headley
BigTrends.com
1-800-244-8736