Weekly Market Outlook – Friday’s Pullback Was Scripted, and Not Yet a Cause For Concern

Friday’s jobs report eventually tipped the stock market back into the red for the week. Or, maybe that wasn’t the reason, but rather, just the trigger. Perhaps stocks were going to peak and pull back on Friday either way. All it took was a kiss of a couple of well-established technical ceilings to get the ball rolling.
The good news? Even with the setback both of the key market indexes remain above their most critical technical floors. The bigger-picture uptrend remains intact.
We’ll look at both charts in some detail in a moment. Let’s first look at last week’s biggest economic announcements and preview what’s coming this week. It’s going to be a big one, with several items in the queue apt to impact inflation, and therefore impact interest rates.
Economic Data Analysis
We rounded out the Institute of Supply Management’s monthly measure of economic strength last week on Tuesday, with a look at February’s ISM Services Index figure. You may recall the ISM Manufacturing Index figure tumbled last month, squelching its budding recovery effort just a bit. Well, the services number did the same.
ISM Services, Manufacturing Index Charts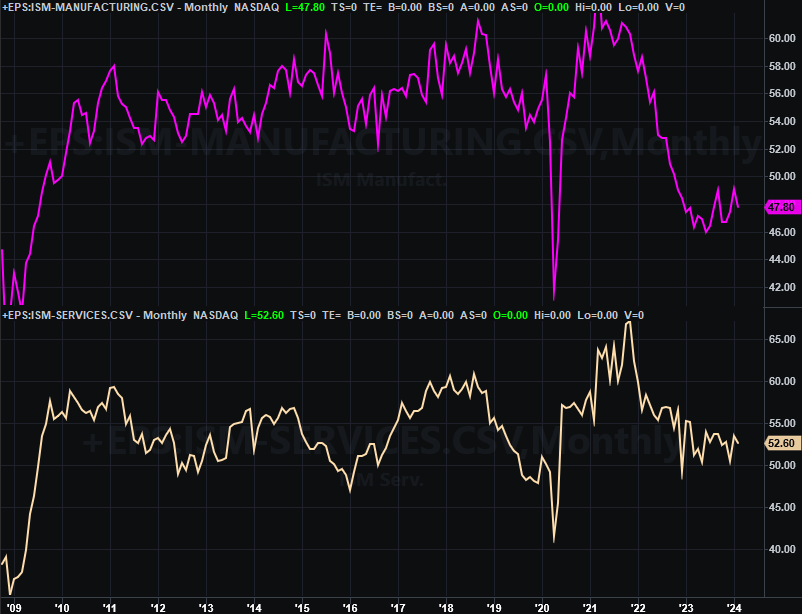
Source: Institute of Supply Management, TradeStation
At 52.6, the ISM Services Index remains above the pivotal 50 mark. It doesn’t take a rocket scientist, however, to recognize this number is clearly on the defensive.
The only other biggie posted last week was a whopper – February’s jobs numbers. Payroll growth was fair, up 275,000 jobs versus expectations (although January’s figure of 335,000 was dialed back to a revised 229,000). But, even so, the unemployment rate was ratcheted up from 3.7% to 3.9% thanks to the additional 334,000 people who are newly unemployed, bringing that count up to 6.5 million people.
Unemployment Rate and Payroll Growth Charts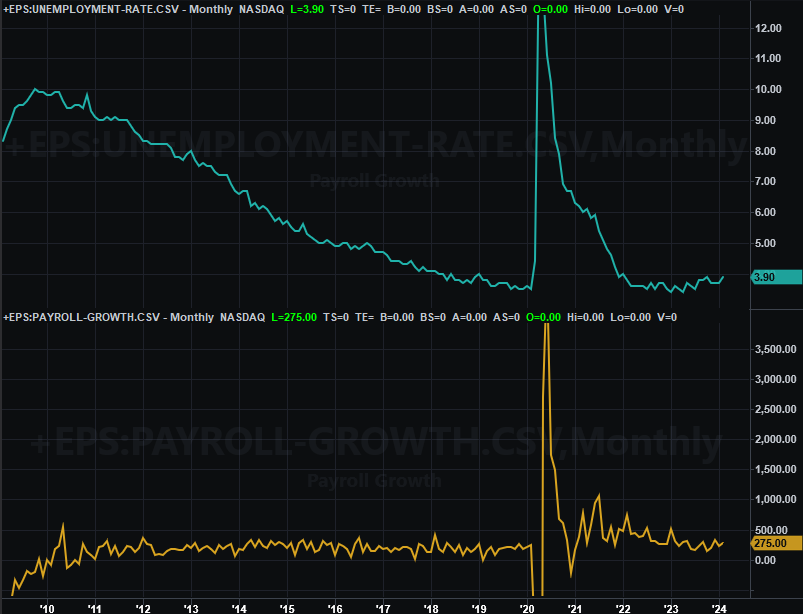
Source: Bureau of Labor Statistics, TradeStation
And that number is pretty real. Layoffs are surging. February’s layoffs, in fact, were the highest figure for any February going all the way back to 2009.
Everything else is on the grid.
Economic Calendar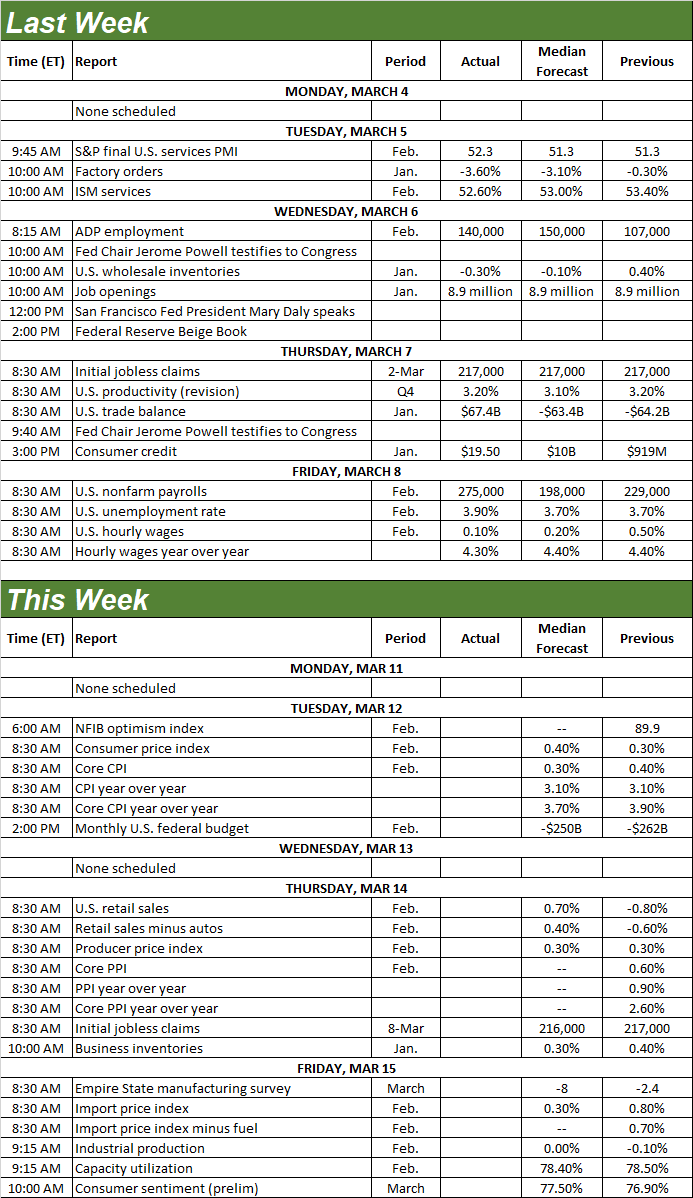
Source: Briefing.com
The party doesn’t stop this week, including as it pertains to potential interest rate cuts. On Tuesday we’ll hear about last month’s consumer inflation, with producer inflation data due on Thursday. Economists are roughly looking for more of the same, which is generally too high.
Inflation Rate Charts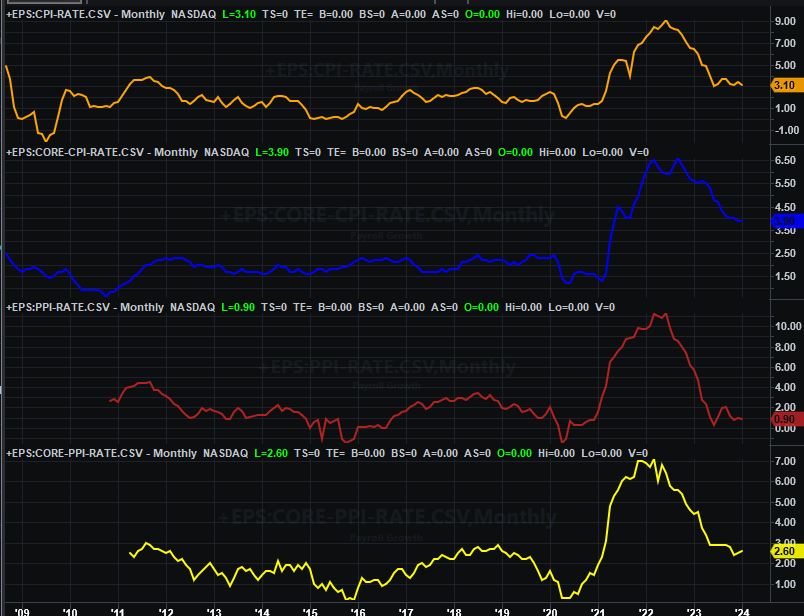
Source: Bureau of Labor Statistics, TradeStation
Retail sales figures are also due on Thursday. The forecasts suggest a healthy bounceback from January’s unexpected lull, but even with such a bounce it would be too soon to say consumer spending is as robust as it was just a few months back. At best retail consumption is just flattening out.
Retail Sales Charts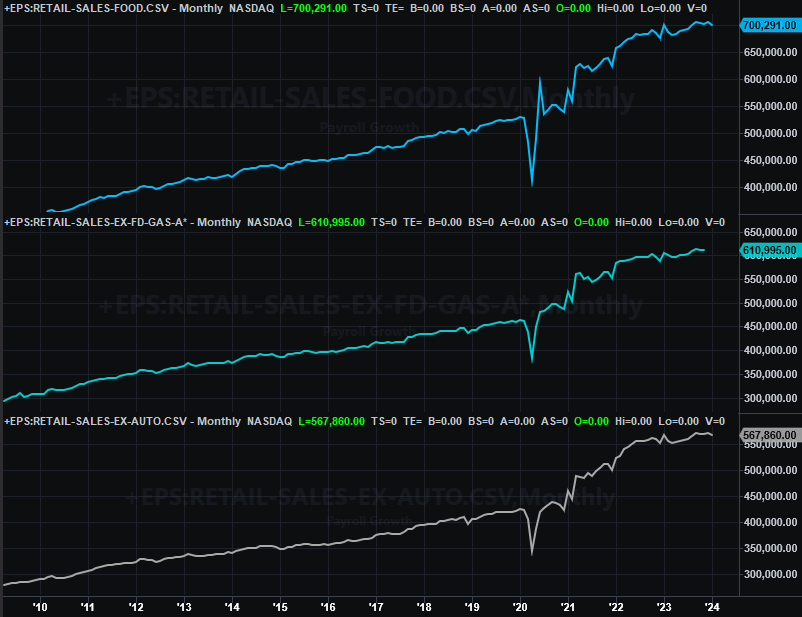
Source: Census Bureau, TradeStation
Finally, on Friday look for February’s capacity utilization and industrial production data from the Federal Reserve. Both numbers have been weakening since 2022, and economists don’t believe this bigger-picture trend has changed much since January.
Capacity Utilization and Industrial Productivity Charts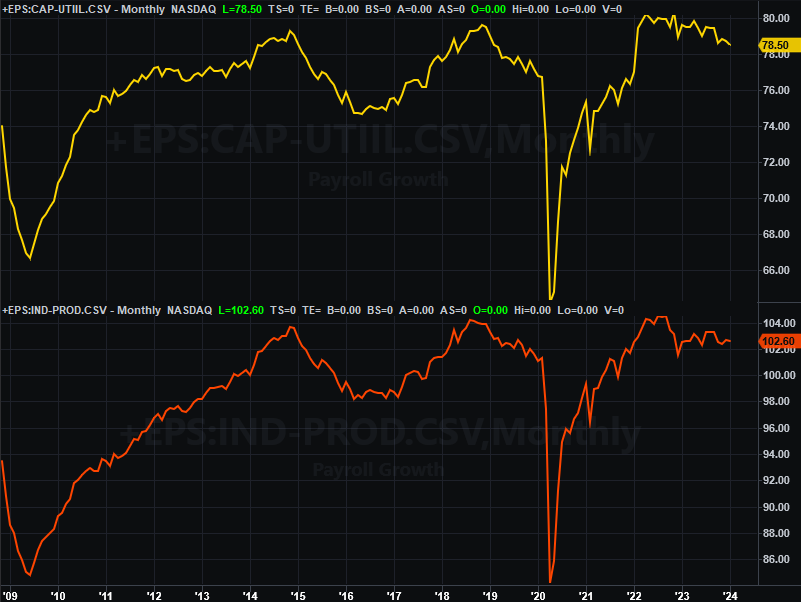
Source: Federal Reserve, TradeStation
They’re not horrible figures. But, they suggest the economy is on the defensive… as do the job numbers, and maybe retail sales data.
Stock Market Index Analysis
A week ago we reminded you that both of the key market indexes were trapped -- guided -- by rising support and resistance levels. They still are. In fact, the upper boundary is right where Friday’s reversal started, right on cue. Take a look at the daily chart of the NASDAQ below to see for yourself. Friday’s pre-reversal peak only had to kiss the line that connects all the key highs going all the way back to October (orange, dashed). Also notice, however, the composite is also still above its 20-day moving average line (blue). The 20-day line even served as a springboard for Tuesday’s and Wednesday’s bounce, in fact.
NASDAQ Composite Daily Chart, with VXN and Volume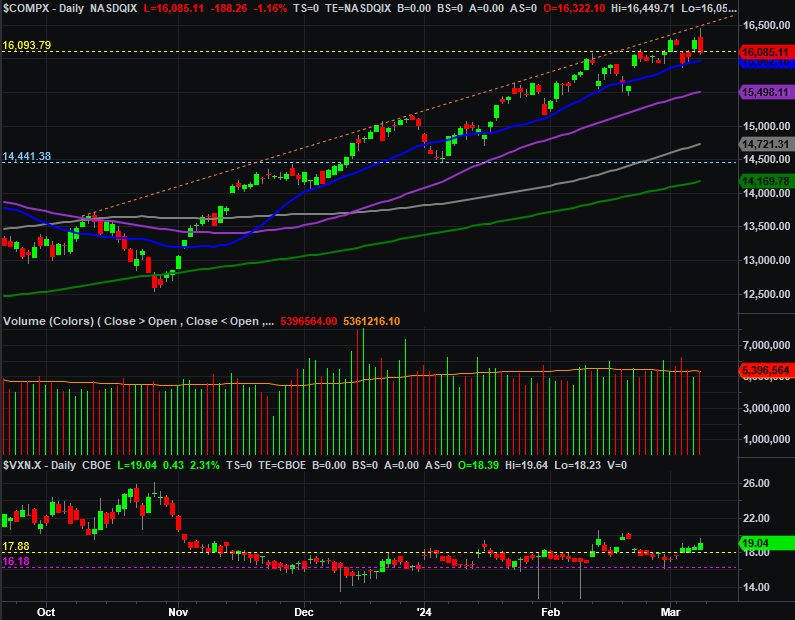
Source: TradeNavigator
The S&P 500 did the exact same thing with its exact same line. That is, the index only had to bump into the line (light blue, dashed) that connects every high since October. There’s clearly something about that line.
S&P 500 Daily Chart, with VIX and Volume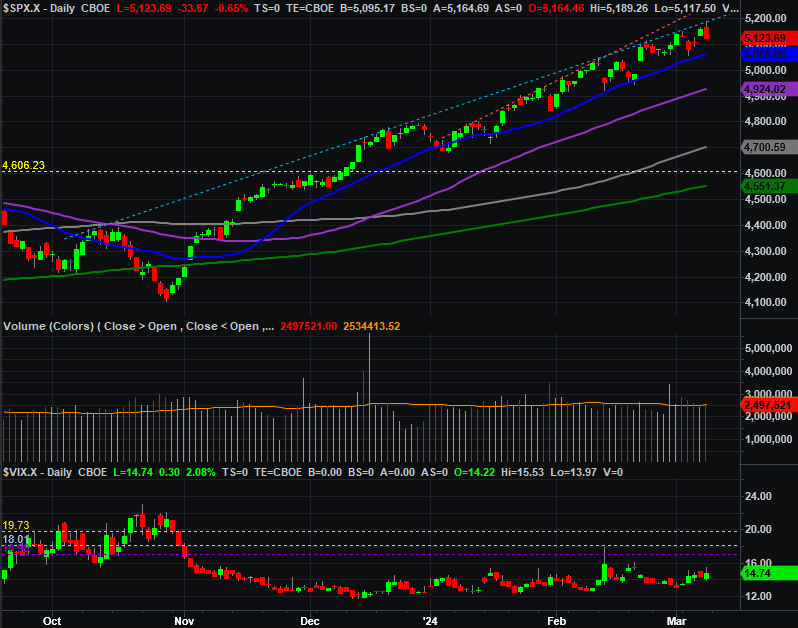
Source: TradeNavigator
Here’s the weekly chart of the NASDAQ. No real surprises here, but from this vantage point we can see something curious. Last week’s bar has elements of being both and “inside day” and an “outside day.” That is, last week’s open and close is below and above the previous week’s close and open. But, last week’s high is above the prior week’s peak, and last week’s low is below the prior week’s low. And of course, the net gain from two weeks back is directionally reversed with last week’s action. That’s a hint of a significant tidal turn.
NASDAQ Composite Weekly Chart, with VXN and Volume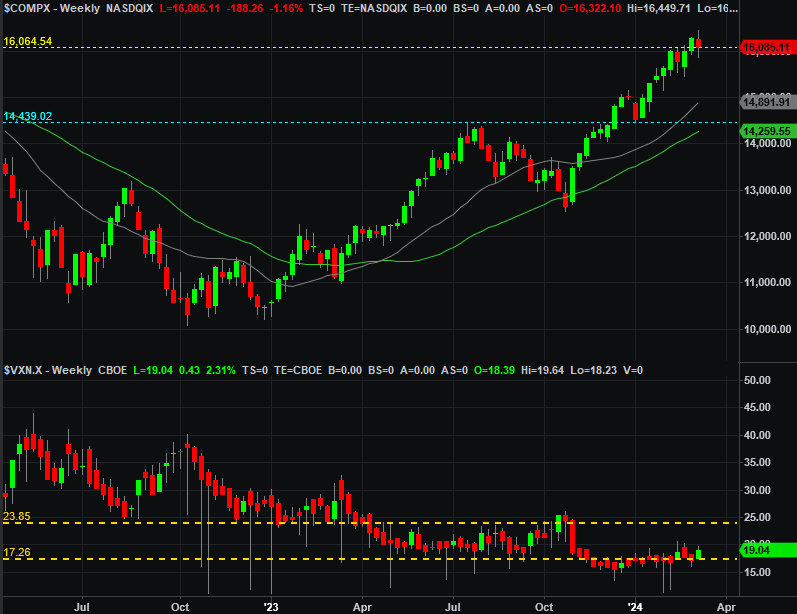
Source: TradeNavigator
The S&P 500 left behind the same pattern, underscoring the odds of a more corrective move. And like the NASDAQ Composite, you can see the S&P 500 has rallied a ton since October’s low. There’s lots of pent-up profit-taking potential waiting in the wings here, much like there was as of August last year.
S&P 500 Weekly Chart, with VIX and Volume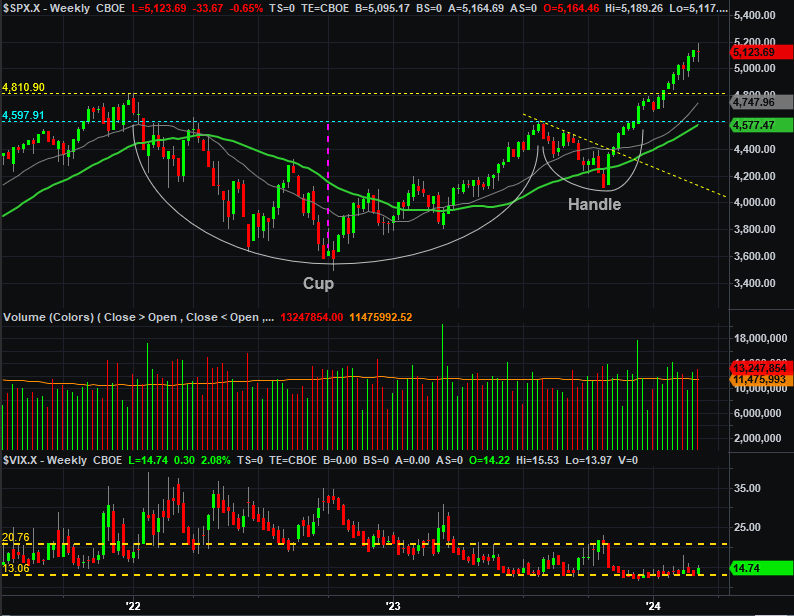
Source: TradeNavigator
You’ll also see on both weekly charts that the volatility indexes (the VIX and VXN) are starting to show clear -- even if shallow -- signs of moving higher. It’s another subtle sign that investors are starting to understand this advance could be running out of steam.
All the same, the bigger-picture trend is still bullish. The indexes are also still holding above even their nearest technical support levels… the 20-day moving average lines, in this case. As long as those hold, we’ll have to remain bullish even with the red flag we got last week. And, even then we should give the indexes room to slide all the way back to their 50-day moving average lines (purple) before presuming the selling’s got any real momentum.