Weekly Market Outlook - Four Straight Days of Gains Blindsides the Doubters

It's not enough to say with absolute certainty that stocks are out of the woods. But, last week's gains during the holiday shortened week were certainly enough to hint that the prior week's weakness wasn't necessarily on omen of things to come.
More than anything though, stocks remain beholden to COVID-19 news even if that didn't seem to be much of a factor last week.
We'll explore last week's victory for the bulls below, which brought them all back from the edge of a cliff. First though, let's recap last week's big economic announcements and preview what's in the cards this week. Thursday's jobs report for June, of course, was the biggie.
Economic Data Analysis
It was a busy week, made busier by the fact that it was condensed into just four days.
The party started on Tuesday, with a surprisingly strong consumer confidence reading that wasn't actually a big surprise given all the bullishness of late... and now, huge job gains. More on that below. As for sentiment, economists were only expecting the Conference Board to report a June reading of 92.0, up from May's 85.9. We got a huge bump to 98.1.
Consumer Sentiment Charts
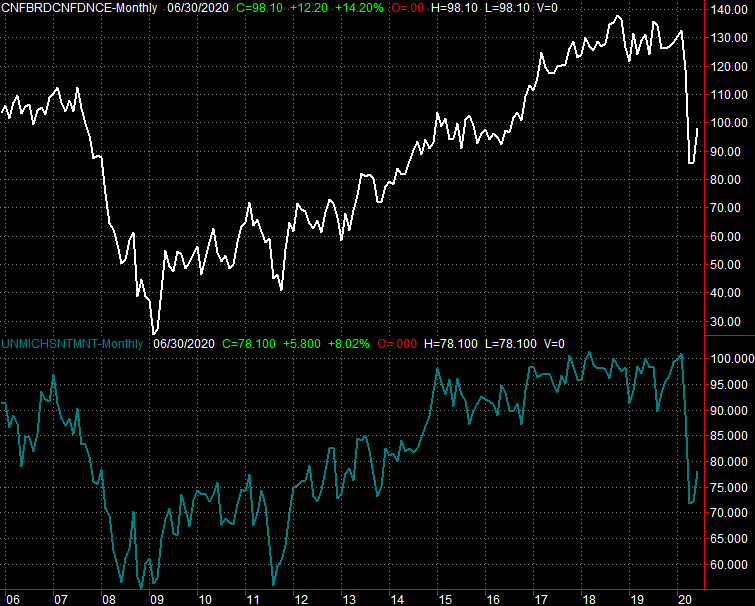
Source: Univ. of Michigan, Conference Board, TradeStation
Ditto for the ISM reading for June.... the manufacturing one anyway (we won't get the services version of the index until this week). Economists were looking for a print of 49.2, but it actually eclipsed the pivotal 50 mark to reach 52.6. It remains to be seen if the services index can rise similarly, with so many stores and restaurants still doing limited duty.
ISM Index Charts

Source: Institute of Supply Management, TradeStation
It's still too early to find the final tally on automobile sales for June, but given the numbers thus far it looks like we'll see a nice follow-through on May's rebound from April's plunge.
Automobile Sales Charts

Source: St. Louis Federal Reserve, TradeStation
Last week's most-watched data was obviously June's jobs report. It was not only good, but much better than expected. Economists were only calling for the addition of 3.5 million jobs leading to an unemployment rate of 12.6%. There were actually 4.8 million jobs added, driving the unemployment rate down to 11.1%.
Payroll Growth and Unemployment Rate Charts
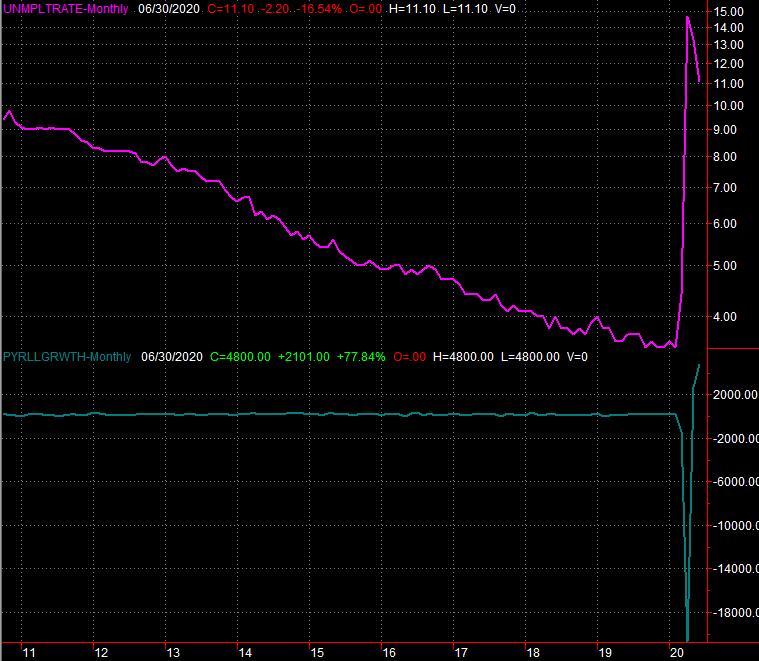
Source: Department of Labor, TradeStation
Everything else is on the grid.
Economic Calendar

Source: Briefing.com
As was noted, this week we'll get the ISM Services Index. The pros are looking for an improvement, but only from 45.4 to 49.0. We'll see.
The only other item of interest on this week's dance card is the inflation data coming late in the week. We'll get producer inflation numbers on Friday, with consumer data not due quite yet. Economists only expect a mild reversal of May's mild core deflation for factory inputs and manufacturing supplies, and another modest increase for overall inflation.
Inflation Rate Chart
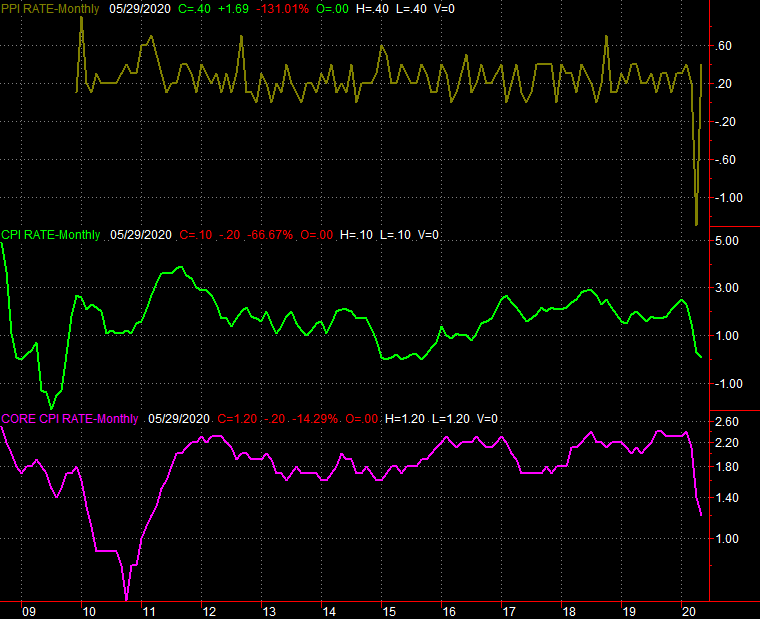
Source: Bureau of Labor Statistics, TradeStation
Stock Market Index Analysis
We'll start this week out with a look at the weekly chart of the S&P 500, just because we need to start with some bigger-picture perspective. It's from this vantage point we can see (1) the 50-day moving average line plotted in purple appears to have become a big line in the sand, (2) there's been some rather significant consolidation over the course of the past five weeks, and (3) as impressive as last week was, it wasn't a high-volume affair.
S&P 500 Weekly Chart, with Volume
Source: TradeNavigator
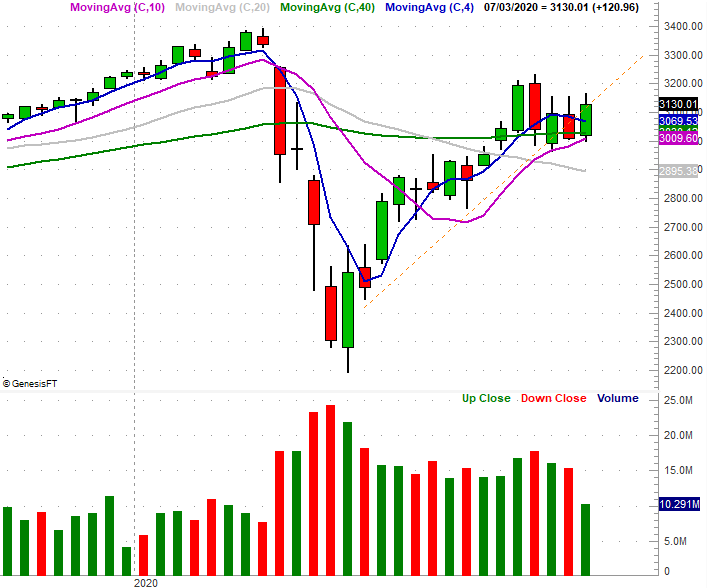
Zooming into the daily chart sheds a little more light on the situation. Namely, we can see that it's actually the 200-day moving average line (green) that's acting as support, and that the light volume last week wasn't just due to the shortened week. Stocks made plenty of progress, up 4% for the four-day stretch. But, there weren't a whole lot of people who jumped on board. In the grand scheme of things, stocks are still consolidating. The whole "sell in May" thing may still be in play.
S&P 500 Daily Chart, with VIX and Volume
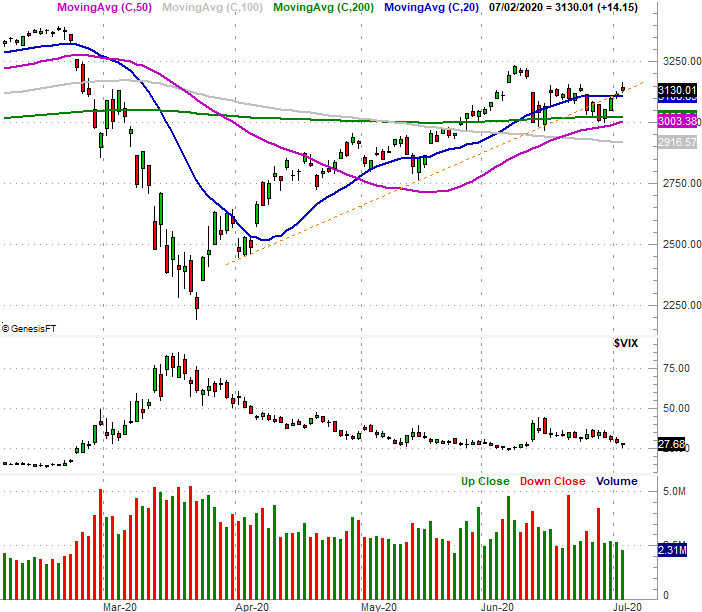
Source: TradeNavigator
The same basic idea applies to the NASDAQ, even though the composite managed to fight its way to record highs last week. It just didn't get there on the most convincing of volume. In fact, the NASDAQ's daily chart - when breaking out its daily up and down volume - shows deteriorating bullish volume and burgeoning selling volume rally wore one.
NASDAQ Composite Daily Chart, with Up and Down Volume
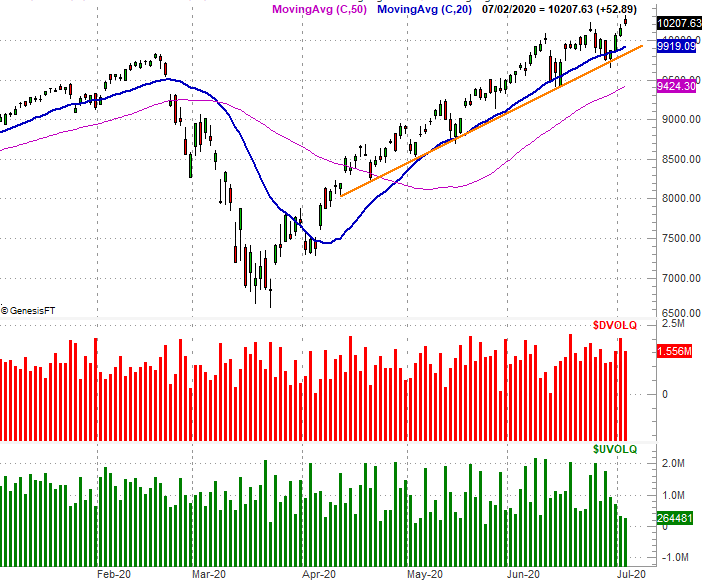
Source: TradeNavigator
The weekly chart of the NASDAQ illustrates just how far the composite has come to bump into record-high territory last week... and how overnight it is as a result. It's possible this could the be first part of a true meltup. More plausibly though, with the RSI indicator into overbought territory and the NASDAQ now being a whopping 16% above its 200-day moving average line (green), weakness seems more likely. The key? Breaking below that orange support line that connects all the major lows going back to mid-April.
NASDAQ Composite Weekly Chart, with VXN, RSI and MACD
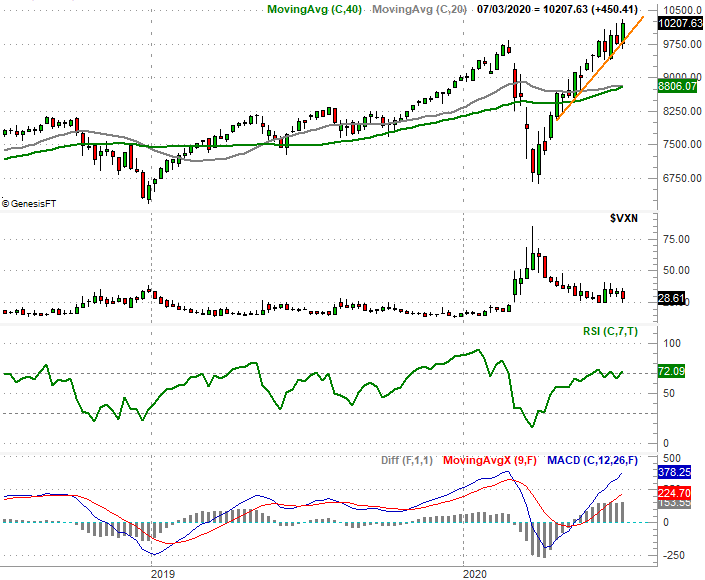
Source: TradeNavigator
This week's most interesting chart, however, is the daily chart of the Dow Jones Industrial Average... the only index that didn't hurdle its 200-day moving average line in the past three weeks. In fact, it and the 20-day moving average line (blue) seem to be serving as technical resistance right now (highlighted).
Dow Jones Industrial Average Daily Chart, with Volume
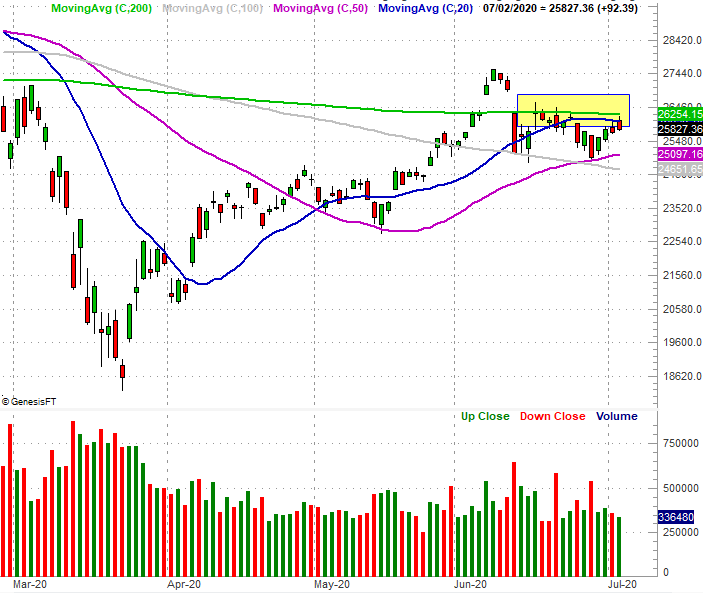
Source: TradeNavigator
Leadership the NASDAQ Composite is important; that's how any marketwide rally is going to start and be sustained. But, if the rally is built to last at some point the blue chips would have to start participating in it. For now all we know is the Dow is trapped between major support and resistance boundaries.
The smart-money move here is waiting to see how this plays out.