Weekly Market Outlook – Don’t Read Too Much Into the Recovery Effort Just Yet

After stocks broke their eight-week win streak two weeks ago, the market recovered pretty well last week. Just don’t overreact or read too much into it. Neither of the indices actually hurdled an important technical level. There’s still a chance the stock market could tumble back into more serious trouble.
On the flipside, both indices are back above a different (and similarly important) technical floor.
We’ll look at all of this in some detail in a moment. First, however, let’s look at last week’s most important economic announcements and then preview what’s coming this week. There’s a lot that could move things in the lineup.
Economic Data Analysis
We only got one round of data last week worth looking at. That’s inflation. It’s still under control, but perhaps not as much as many were hoping for. Annualized price increase ticked higher again in December after November’s dip… the second time we’ve seen this happen within the past few months. It’s not raging out of control, but this is the sort of report that could serve as a hint of more pricing pressure than there seems to be on the surface. This is course calls into question the Fed’s presumed, hoped-for plans to lower interest rates later on this year.
Inflation Rate Charts (Annualized)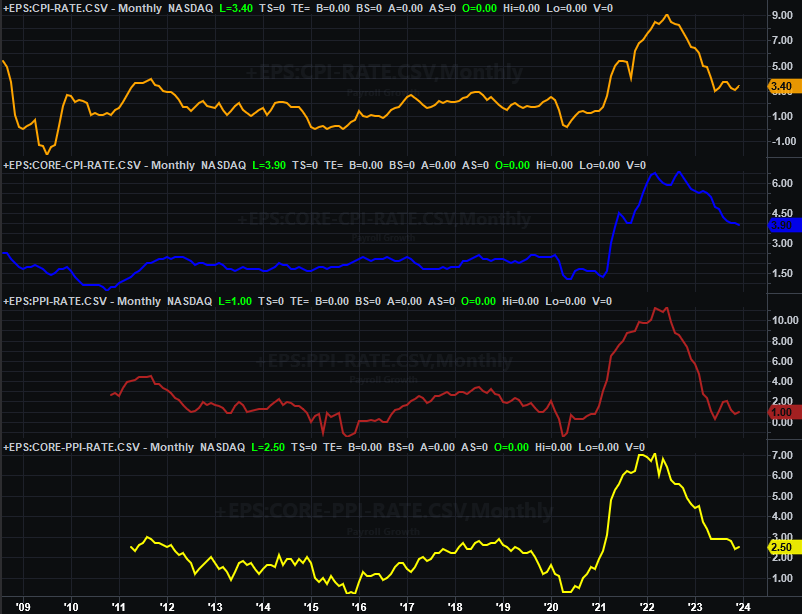
Source: U.S. Bureau of Labor Statistics, TradeStation
That’s not to say the FOMC can’t or won’t cut interest rates as has been suggested of late. All we can say right now is, there’s no wiggle room or margin for error in this regard. We may get pushed into a market-undermining recession yet. (The yield curve is still inverted, by the way, complicating the Fed’s ability to lower rates as many expect.)
Everything else is on the grid.
Economic Calendar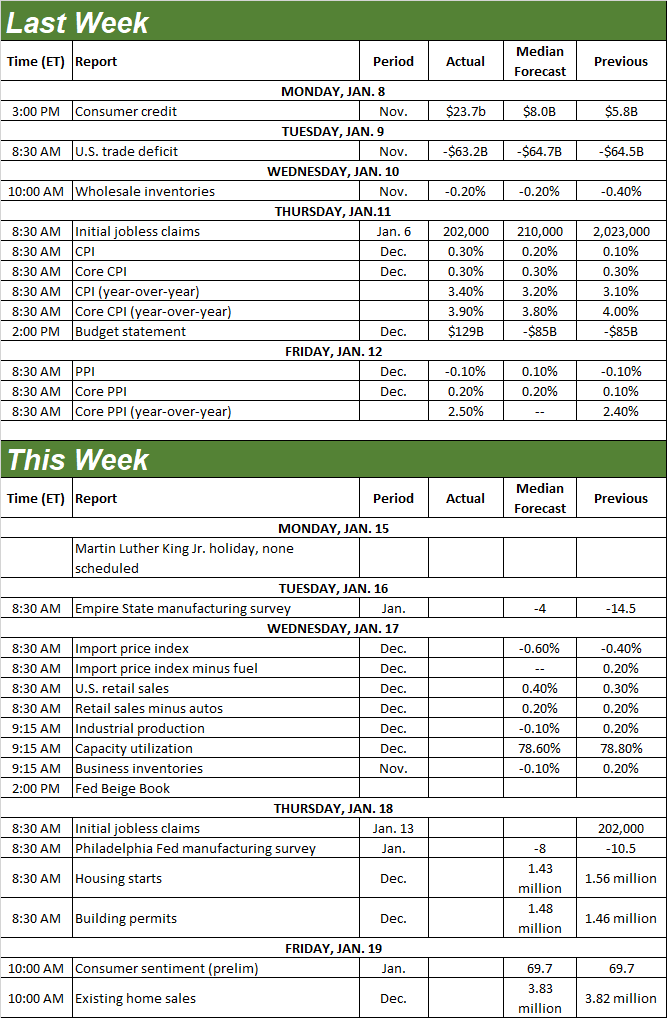
Source: Briefing.com
This holiday-shortened week is loaded up with several important reports.
Most of the party happens on Wednesday, starting with last month’s retail sales and finishing up with December’s industrial production and capacity utilization figures.
As for retail sales, economists are looking for a slight improvement on November’s also-healthy forward progress. Note that spending growth is slowing down (in a bigger-picture sense), although we’re still seeing progress here.
Retail Sales Charts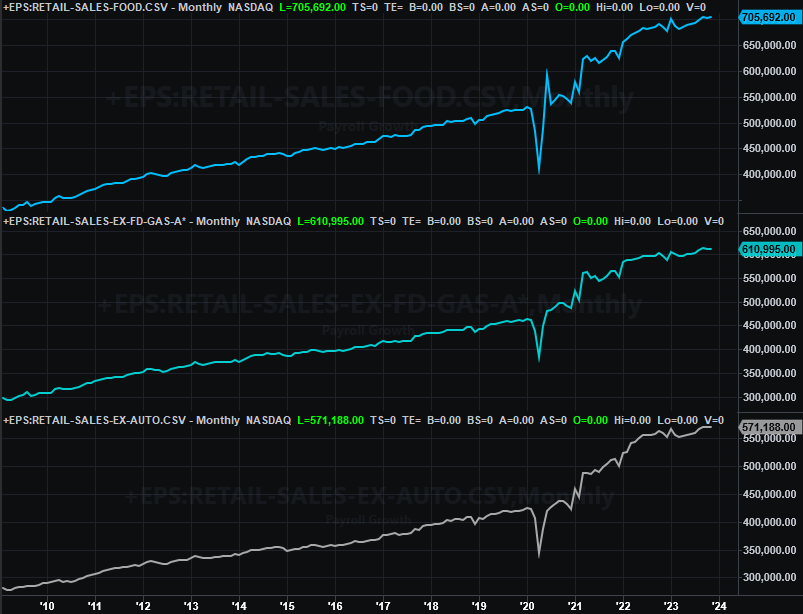
Source: Census Bureau, TradeStation
The nation’s factories’ output appears to have already peaked as well. Capacity utilization as well as actual production have been drifting lower since the middle of last year. And, forecasters believe this was still the case as of December.
Industrial Production and Capacity Utilization Charts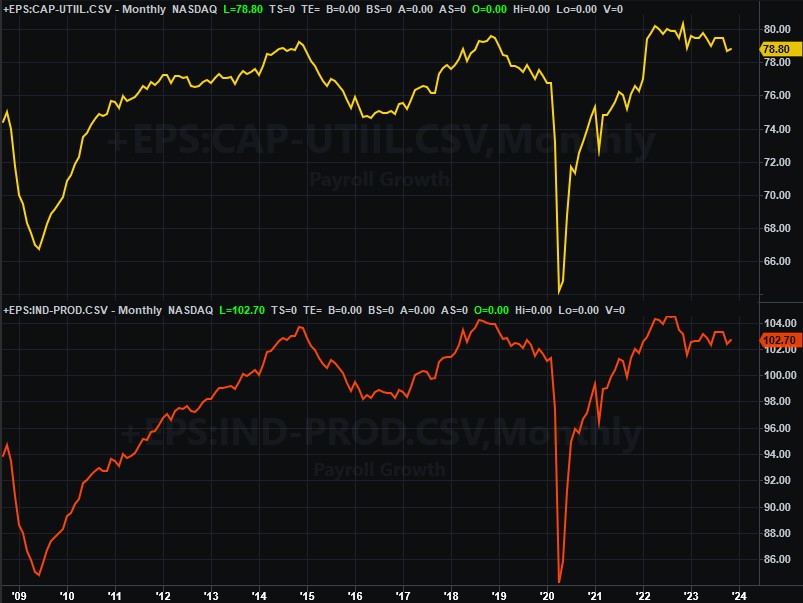
Source: Federal Reserve, TradeStation
This is a problem. While the Federal Reserve’s regular look at the country’s factory activity isn’t a highly-watched report, the correlation between it and corporate earnings and the stock market itself.
It’s also the beginning of a wave of real estate numbers. On Thursday, for instance, we’ll get last month’s housing starts and building permits. Permits should be more or less in line with November’s levels, but starts are expected to peel back a bit from November’s unusual surge. Note that -- again in the bigger-picture sense -- these numbers are holding at pretty anemic levels.
Housing Starts and Building Permits Charts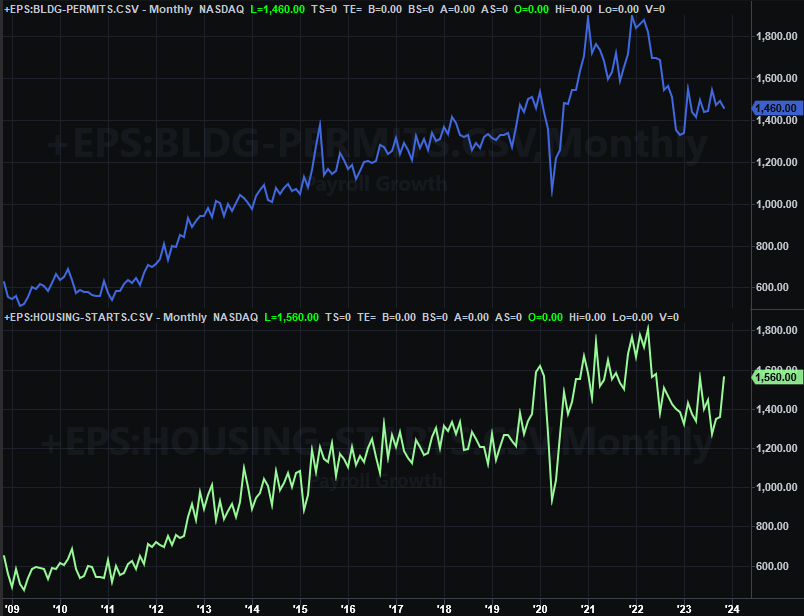
Source: Census Bureau, TradeStation
December’s look at sales of existing homes is due on Friday. They should be right around November’s number, although that’s a particularly low (multi-year-low, in fact) figure. Again, it suggests the real estate market is weaker than the price numbers alone suggest.
Home Sales Charts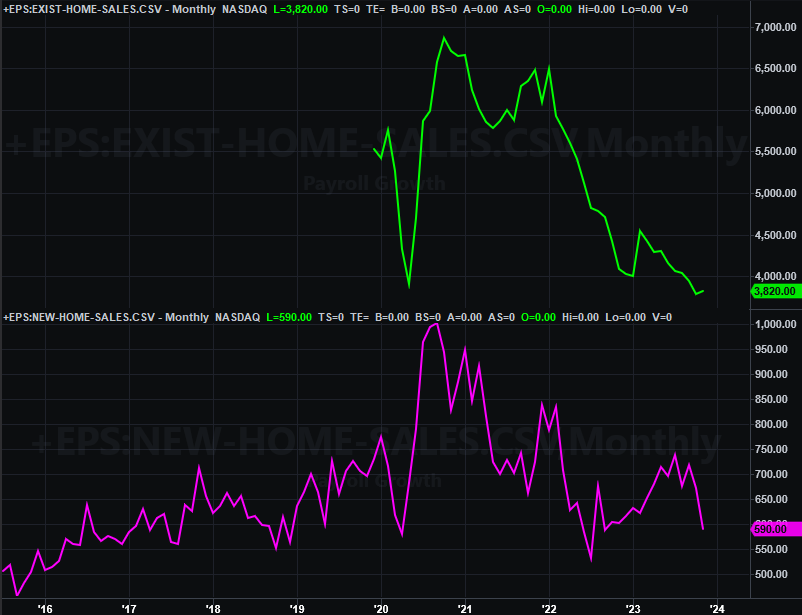
Source: Census Bureau, National Association of Realtors, TradeStation
New home sales numbers will be posted on January 25th. Note that sales of newly-built houses are also in a freefall right now, underscoring the argument that the real estate sliver of the economy is in more trouble than it may seem from certain vantage points.
Stock Market Index Analysis
Yes, the market bounced back last week. Just don’t be too quick to overreact. Even with its 1.8% rebound, however, the S&P 500 remains below its December high of 4,793. That’s also just below its all-time peak around 4,811 hit in the last part of 2021. The index will really need to clear this area first before we can be firmly bullish. But, given how the index is still up so much for the past eleven weeks, there’s not a great deal more room left for immediate upside.
S&P 500 Weekly Chart, with VIX and Volume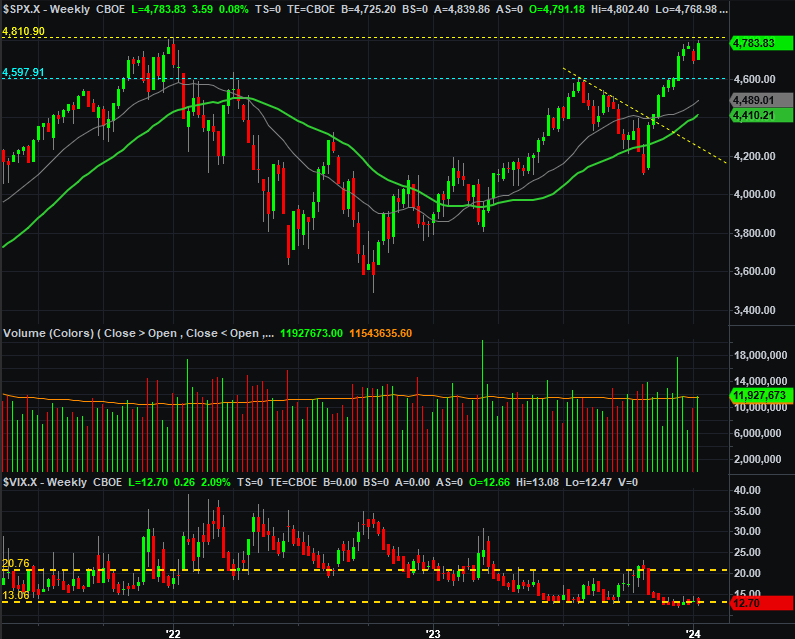
Source: TradeNavigator
Here’s the weekly chart of the NASDAQ Composite. It’s got some clear similarities. Namely, the index didn’t move back above last month’s high at 14,888 despite its 3.0% gain. Moreover, it remains miles away from its late-2021 peak near 16,212.
NASDAQ Composite Weekly Chart, with VXN and Volume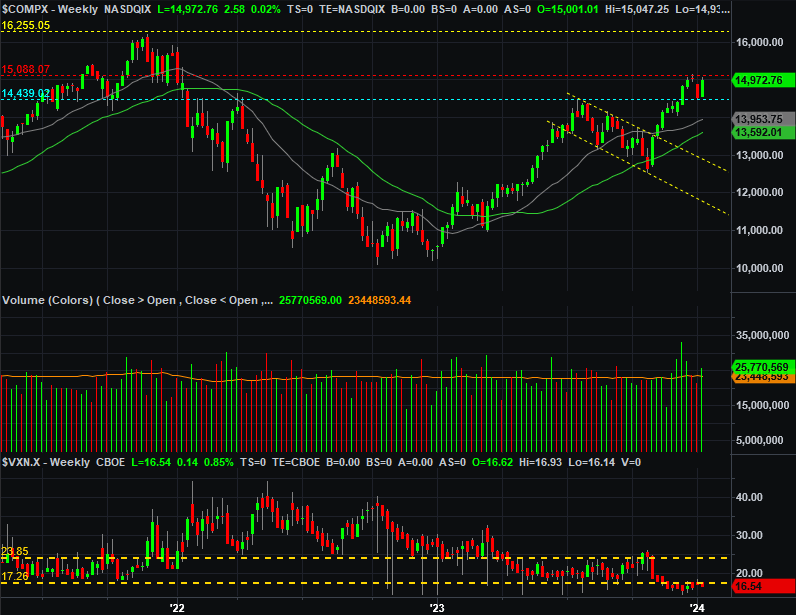
Source: TradeNavigator
Drilling into the daily charts of both indices serves up some important details on the market’s current condition… and likely near-term future. Take the daily chart of the S&P 500 as an example. As was already noted, the absolute resistance level around 4,800 is still above rather than below. As the daily chart also shows us though, the S&P 500 is at least back above its 20-day moving average line (blue) at 4,748. That’s something to push up and off of in the immediate future, instead of something that will act as a ceiling.
S&P 500 Daily Chart, with VIX and Volume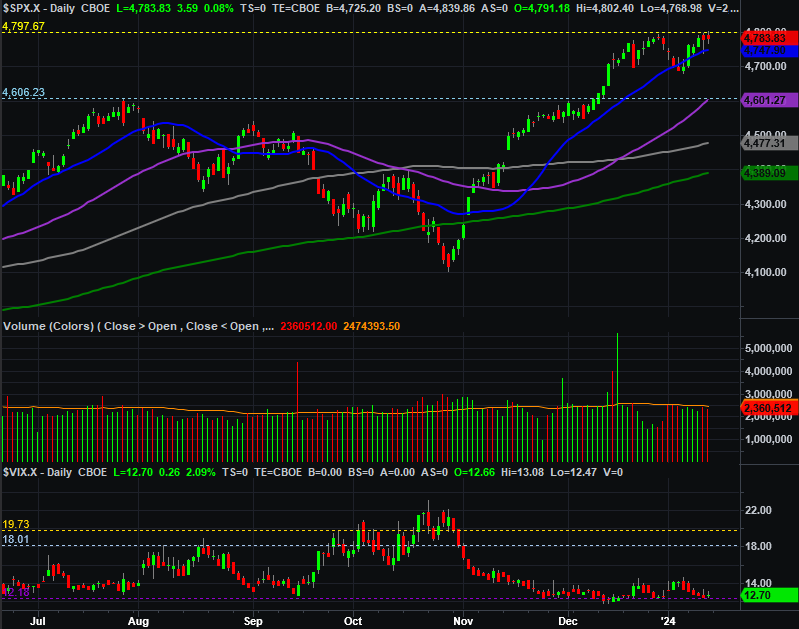
Source: TradeNavigator
Just don’t get too optimistic just yet.
We’ve talked about breadth and depth before. As a refresher though, analyzing breadth (advancers versus decliners) and depth (bullish volume versus bearish volume) tells us much about the true health of a trend’s underpinnings.
With that as the backdrop, the chart below compares the NYSE’s daily advancers (ADV), the exchange’s decliners (DECL), the NYSE’s “up” volume (UVOL), and its “down” volume. We’re not terribly interested in the daily figures; they’re too erratic to make much sense of them. To make meaningful sense of this data, we’ve plotted moving average lines (20-day moving average lines, in this case) of each data set on top of that data set. Doing so shows us the true undertow. We can see at this time that advancers and bullish volume are trending down, while decliners and bearish volume are trending upward.
S&P 500 Versus NYSE Advancers/Decliners and Up/Down Volume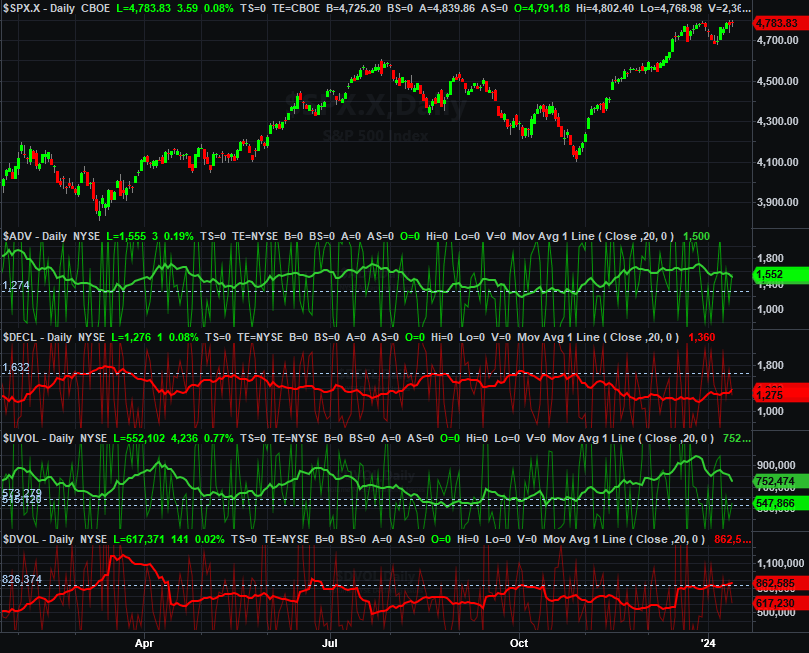
Source: TradeNavigator
It’s possible at least some of this shift towards bearish depth and breadth has to do with the transition out of the old year and into a new one. Such a shift wouldn’t typically lean bearishly, however. It would simply result in suppressed numbers across the board. The current rally has been losing its “umph” since the final full week of last year, and is still losing it.
Bottom line? The trend is still technically bullish, so we must be as well. This is very flimsy bullishness though, made even flimsier by stocks’ current overbought condition. Keep an eye out for breakdowns by keeping an eye on all the indexes’ key technical support levels.