Weekly Market Outlook - Despite Friday's Rebound, Trouble Remains Within Easy Reach

The market snapped back from Friday's intraday loss to close the bulk of last week's setback, although it still closed a tad in the red for the five-day stretch. Good thing too, since any further losses would have pulled the indices under major technical support.
Nevertheless, the market remains within striking distance of its key floors; one or two more bad days could still drag stocks below them, possibly sparking more downside that accelerates the current effort to force a correction.
We'll look at the key lines in the sand in a moment. First, let's recap last week's biggest economic reports and then preview what's coming this week. Spoiler alert: There's no other way to describe December's retail sales as anything other than a major letdown.
Economic Data Analysis
But, first things first. We're swimming in inflation.
That's the only way to describe last month's inflation snapshot as of December. The overall inflation rate (for consumers) stands at a multi-decade high of 7.0%. Even taking out food and gas prices, consumers are paying 5.5% more for stuff than they were a year earlier.
Factories are merely passing along their rising costs. The overall producer inflation rate is now a shocking 9.7%, and still 6.9% on a core basis. Those figures are also both generation highs.
Producer, Consumer Inflation Charts
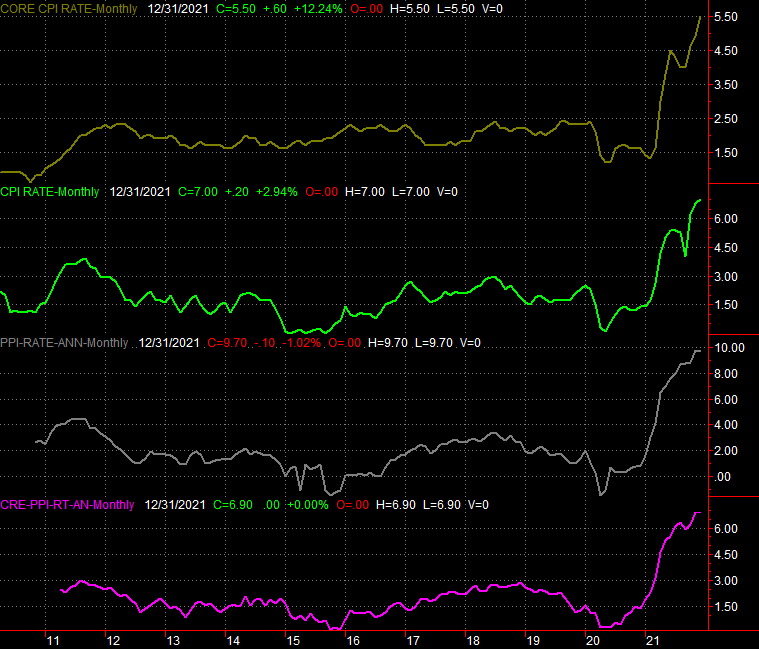
Source: Bureau of Labor Statistics, TradeStation
The Federal Reserve is moving to combat this inflation, for the record, although it may not be enough soon enough.
Perhaps worse, those factories are less busy now than they were a month earlier. In December, the country's utilization of its manufacturing capacity pulled back from 76.6% to 76.5%, missing expectations for a move to a pandemic high of 77.1%. Likewise, actual industrial output contracted 0.1% from November's levels rather than improving the forecasted 0.3%.
Capacity Utilization and Industrial Productivity Charts
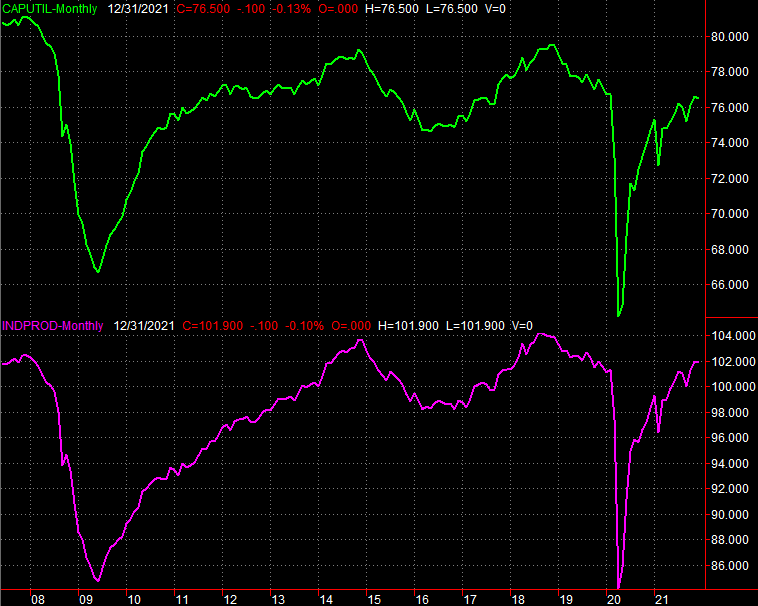
Source: Federal Reserve, TradeStation
One month doesn't make a trend, but all trends start with that first month's pivot. We'll see where this goes. It's possible that December's data may have simply been compared to incredibly firm November numbers.
Or, maybe the overall headwind is quite real.
That's certainly a possibility given last month's retail spending, which fell rather than continuing to grow. In fact, it fell a lot. Taking automobile sales out of the picture, retail sales slumped 1.9% last month, snapping a five-month growth streak that would have been much longer if dismissing the unusual year-over-year comps linked to the pandemic.
Retail Sales Charts
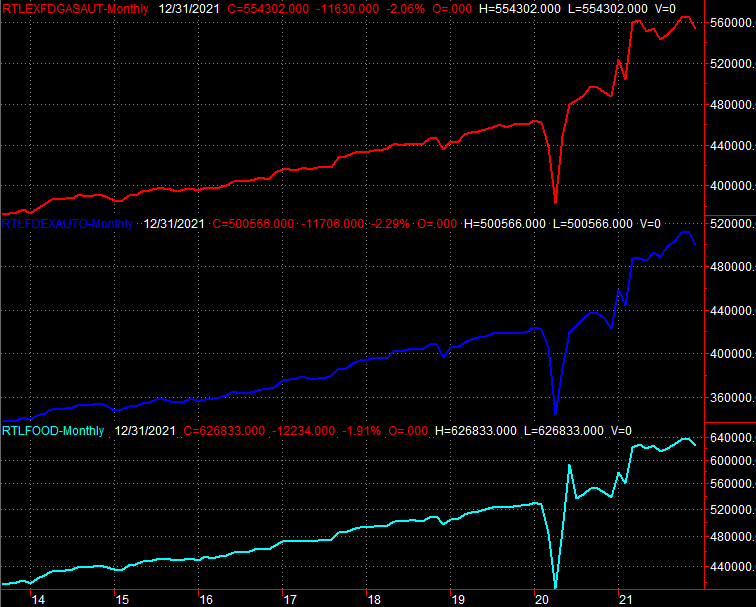
Source: Bureau of Labor Statistics, TradeStation
Again, one month doesn't make or break a trend. All trends start with that first month though. The sudden and sharp slide in retail consumption might mean much more than people simply keeping their wallets and purses closed more than they have of late.
Everything else is on the grid.
Economic Calendar
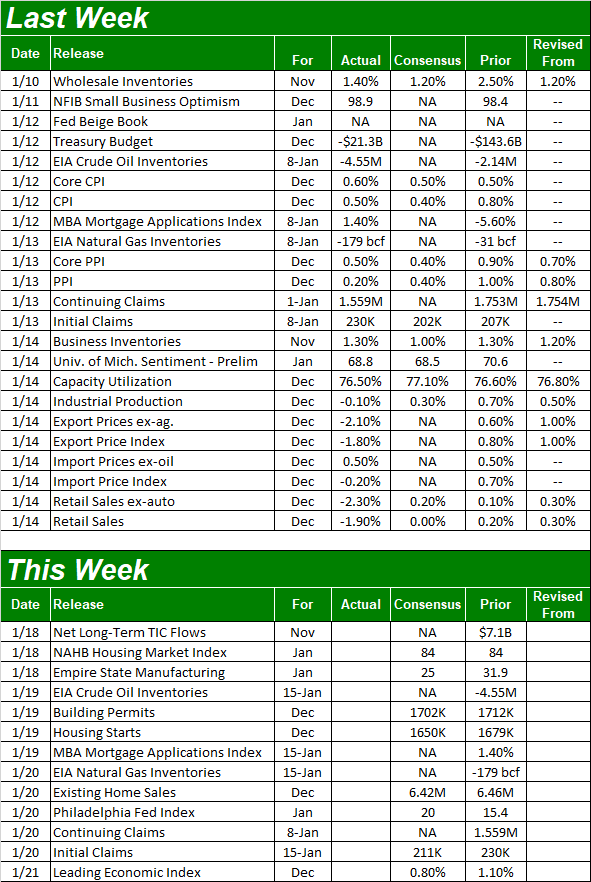
Source: Briefing.com
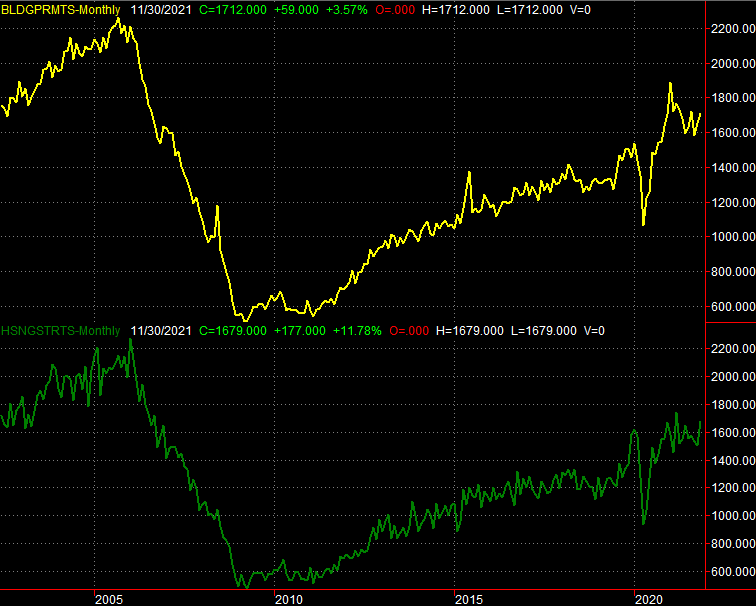
This week isn't going to be quite as busy, but it is going to be a big one for the real estate picture. On Wednesday look for last month's housing starts and building permits, then on Thursday keep your eyes and ears open for December's existing home sales.
As for starts and permits, forecasters believe last month's levels will cool a little bit from November's numbers. And, that's ok. While we're still not seeing the sort of sustained growth we'd like to see here, we're also not seeing a pace of growth or recovery that can't be sustained. We can accept a small setback here as long as it's temporary.
Housing Starts and Building Permits Charts
Source: Census Bureau, TradeStation
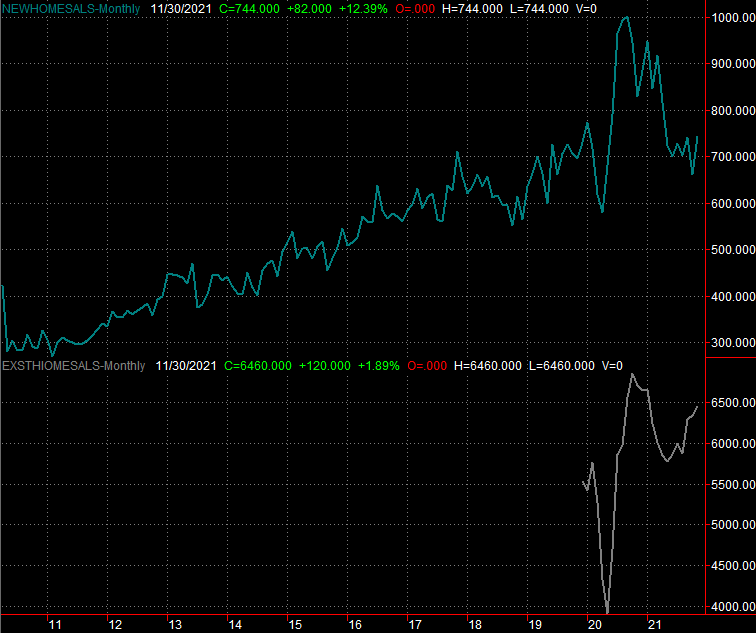
Last month's sales of existing homes are also expected to cool off just a bit. Like starts and permits, that's ok. It's better to make steady -- even if erratic -- progress that can be sustained rather than a go-go rally that flames out too early.
New and Existing Home Sales Charts
Source: Census Bureau, National Board of Realtors, TradeStation
Still, know that any real estate sales data should be taken with a grain of salt. Recently-rising rates and the promise of more rate hikes in the near future are wreaking havoc with demand, for better and worse. It's anybody's guess where things are going next.
Stock Market Index Analysis
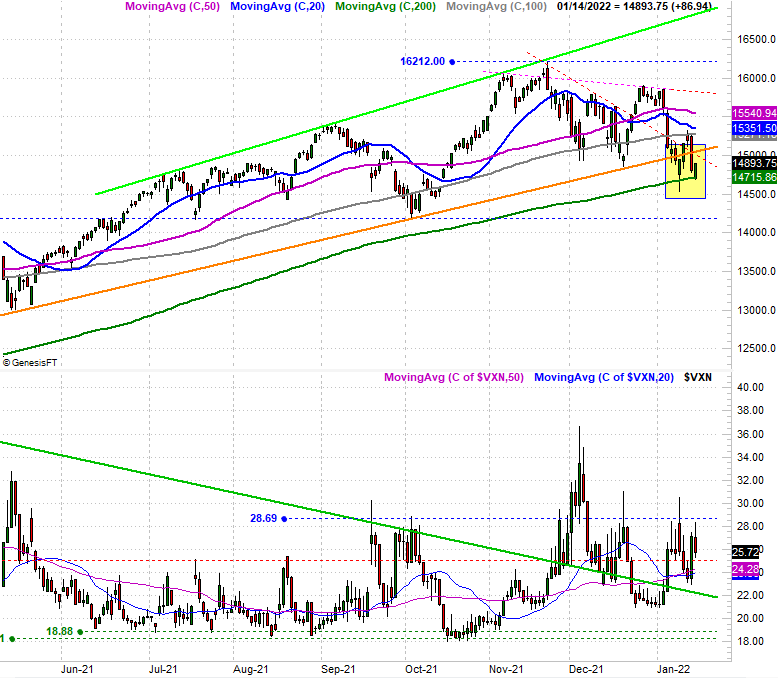
We kick this week off with a look at a daily chart of the NASDAQ Composite, as it's the index closest to the biggest inflection point. Namely, Friday's low touched the 200-day moving average line (green) for the second time that week. Like the first time, the composite bounced back to close above that pivotal indicator. But, it's still putting pressure on that technical floor, and closed below the straight-line support level (orange) that's connected all the key lows going all the way back to March of last year.
NASDAQ Composite Daily Chart, with VXN
Source: TradeNavigator
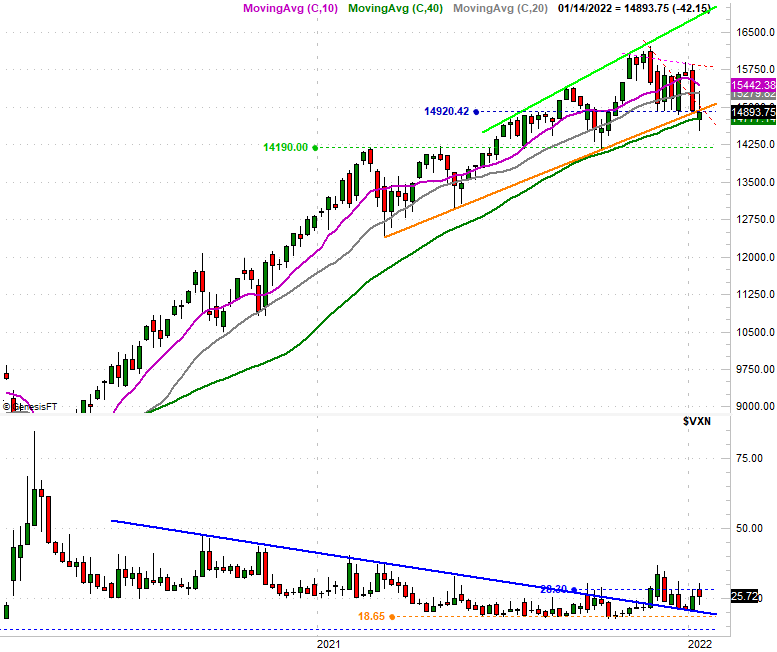
Here's the weekly chart of the NASDAQ Composite. The breakdown is put into more perspective from this vantage point.
NASDAQ Composite Weekly Chart, with VXN
Source: TradeNavigator
Something else is put into perspective with the weekly chart as well... the NASDAQ Composite's volatility index, or VXN. Although it's not quite started a new uptrend yet, it has snapped its downtrend, by virtue of breaking above a long-established falling resistance line (blue) that had been steering it lower since September of 2020. The VXN is working on that new uptrend though. The next move above the ceiling at 28.3 should do the trick, provided the NASDAQ Composite itself is below its 200-day moving average line at the time. As was noted, that seems to be the direction things are moving at this time...
... at least for the NASDAQ. The S&P 500 isn't nearly as close to its breaking point, still holding above the lower boundary of a trading range that's guided it higher since mid-2020. This range is plotted in purple on the chart below.
S&P 500 Weekly Chart, with VIX and Volume
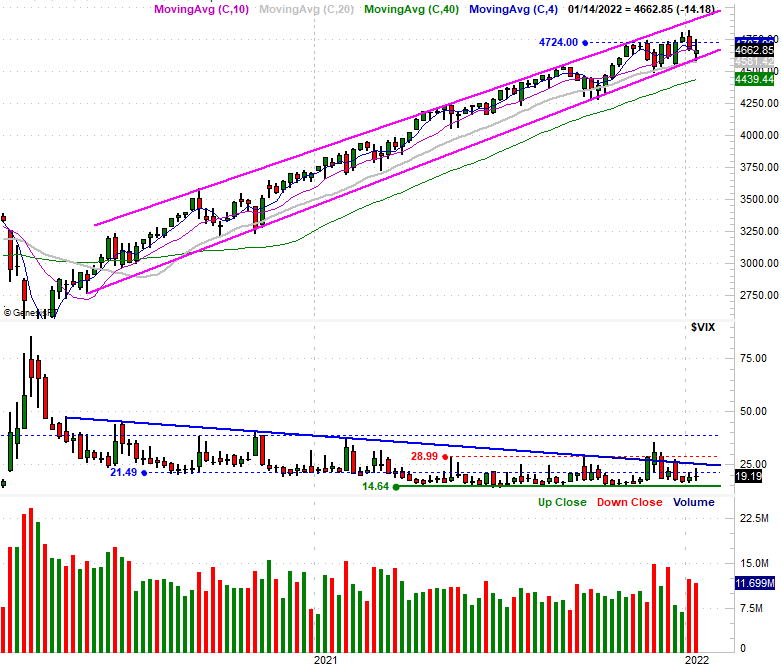
Source: TradeNavigator
As the daily chart of the S&P 500 below shows us, though, the index is once again close to testing that floor. The 100-day moving average line (gray) is also coming back into play as technical support.
S&P 500 Daily Chart, with VIX and Volume
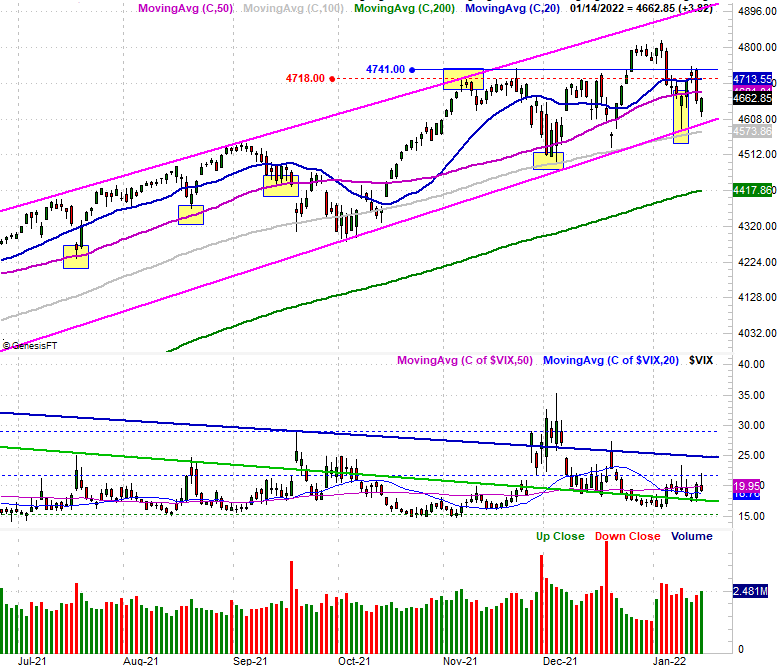
Source: TradeNavigator
Note that the S&P 500's volatility index is also still behind held below a couple of its technical ceilings... one at 21.5, and another at 24.9. There also appears to be a potential ceiling for the VIX around 30.0. As is the case with the NASDAQ Composite, the VIX will have to break above its ceilings AND the S&P 500 will have to break under the crux of its support around 4600 before we can say the index has entered full-blown correction mode. Things could still go either way, but know that we're closer to a breaking point than not.