Weekly Market Outlook - Cracks Are (Finally) Starting to Form
With nothing more than a passing glance last week's losses look run-of-the-mill. We've seen and overcome worse in recent weeks.
Take a second, closer look at last week's action though... which we will below. The stumble was seemingly small, but it was actually huge in one regard. Two of the market's three key indices quietly pulled under some critical technical support levels. We might snap back. But, this is what the first steps of a major corrective move will look like.
We'll slice and dice the situation below, as we always do. First though, let's paint a picture with the broad brush strokes of last week's surprisingly encouraging economic news.
Economic Data Analysis
Inflation is taming itself, albeit slowly.
Two weeks ago we updated the inflation picture with a look at producers' (factories, packagers, etc.) input prices. They were still at crazy levels, but cooling off from soaring increases in July. Consumers' price pain is easing too, to an even greater degree. The overall consumer inflation rate (annualized) now stands at 5.3%, or only 4.0% not counting food or fuel. That's still high, but last month's inflation rates not only fell, but fell short of expectations. It's a step in the right direction, although the Fed may still need to act sooner than later.
Annualized Inflation Rate Charts
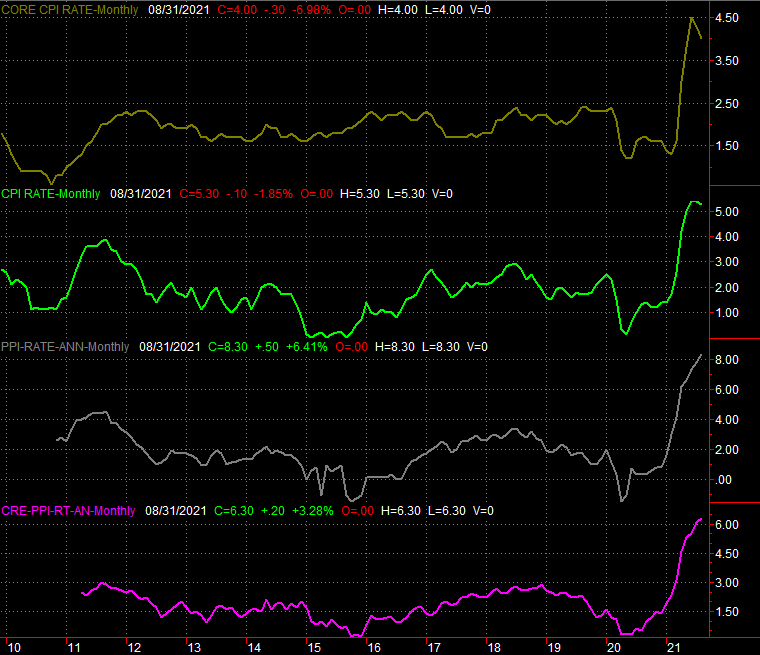
Source: Bureau of Labor Statistics, TradeStation
There's a specific reason the Federal Reserve may still be pressured to cool things off before prices remain persistently painful. That is, the country's factories are still as busy -- busier, actually -- than they've been in months. This indicates consumer and corporate demand for goods and services. Specifically, last month's capacity utilization of U.S. factor production potential rose to 76.4%, and actual production (or output) grew by 0.4% to levels actually seen before the pandemic-prompted plunge in March of last year.
Industrial Production and Capacity Utilization Charts
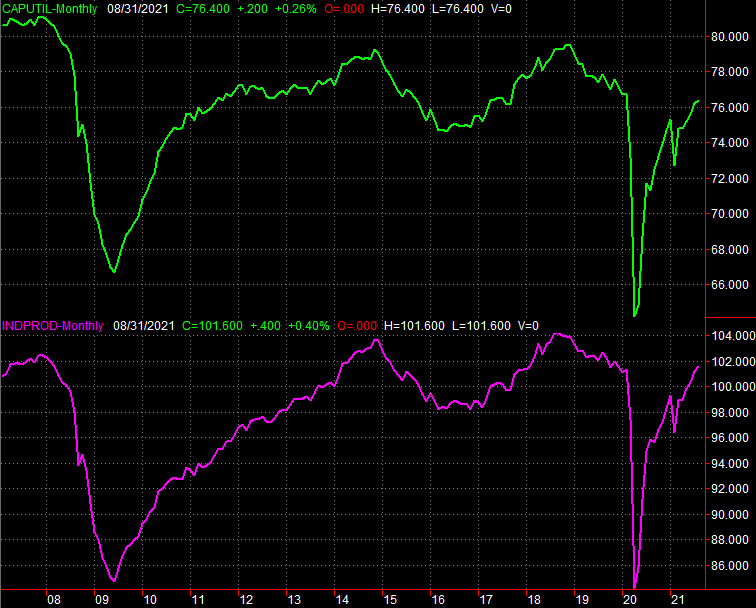
Source: Federal Reserve, TradeStation
We're obviously not back to peak levels seen in 2018, when the economy was really humming. But, the trajectory here is more important than either measures absolute levels.
Finally, on Thursday we heard about last month's retail spending. We needed a pick-me-up here that economists weren't expecting. We got it in spades. Rather than falling the estimated 0.2% from July's consumer spending, it actually jumped 1.8%. The lingering pandemic isn't keeping folks at home any longer.
Retail Sales Charts
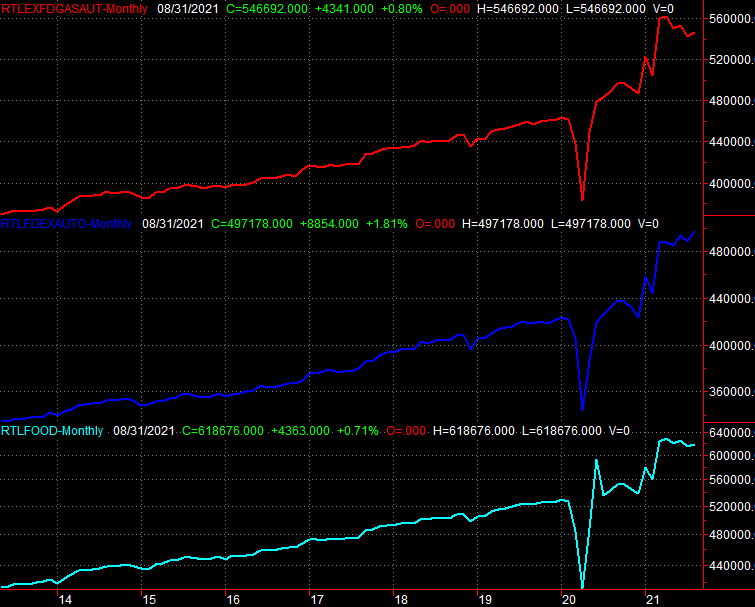
Source: Census Bureau, TradeStation
Everything else is on the grid.
Economic Calendar
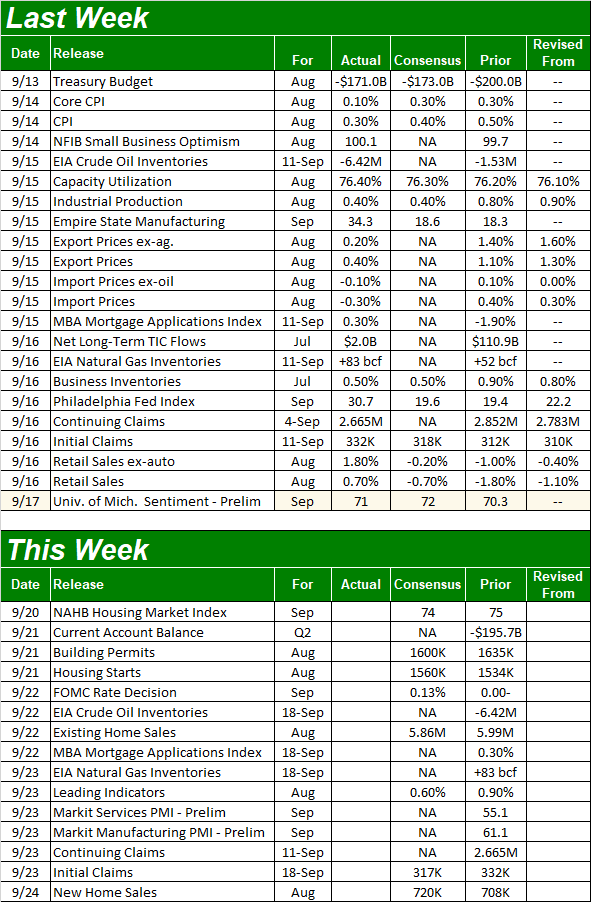
Source: Briefing.com
This week's dance card is rather full as well.
The party starts on Tuesday with a look at August's housing starts and building permits. They're expected to be more or less in line with July's figures, which is ok. Both figures have been hot and cold since early last year, but the forecasted numbers are just back to the bigger trend's average growth.
Building Permits and Housing Starts Charts
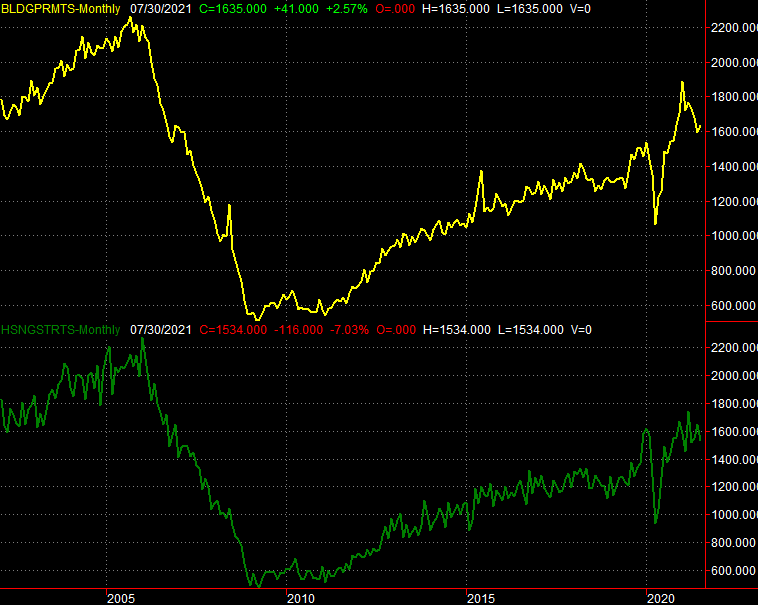
Source: Bureau of Labor Statistics, TradeStation
We're also scheduled to hear last month's new and existing home sales. They also should look like July's figures, which is.... ok. Inventory rather than demand continues to be the biggest impasse, although it's still an impasse... and the bigger trend is still pointed upward.
New and Existing Home Sales Charts
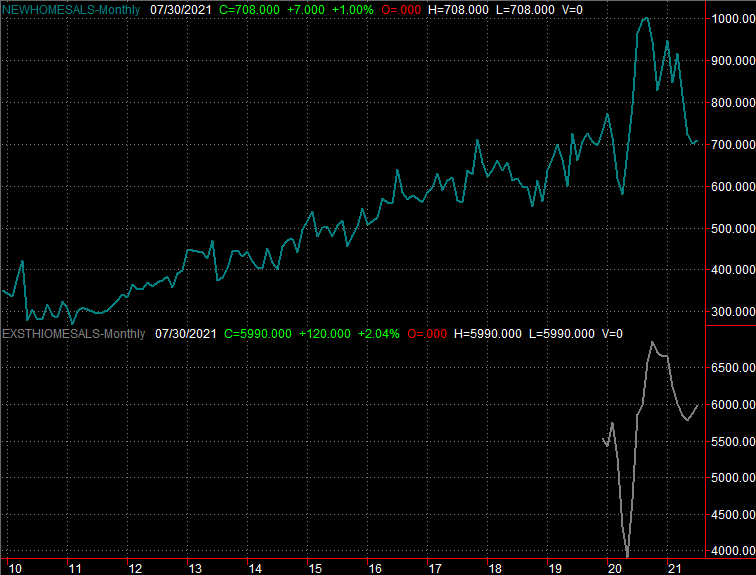
Source: Bureau of Labor Statistics, TradeStation
Also bear in mind that there's a scheduled decision on interest rates for this week. The FOMC isn't apt to waver from its ultra-low target Fed Funds Rate, though as always, the language is the key. Look for changes to the rhetoric from the last time the Fed offered up any commentary on interest rates.
Stock Market Index Analysis
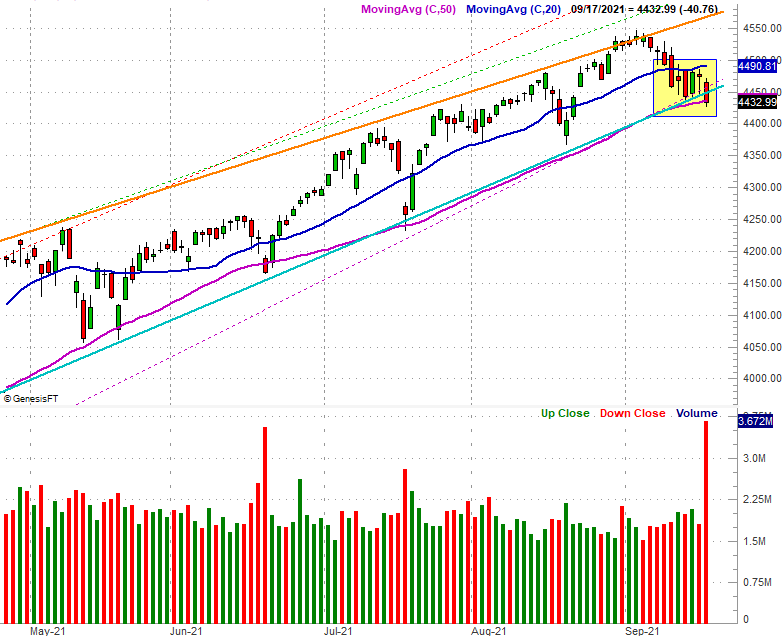
We kick things off this week with a super-zoomed-in look at the daily chart of the S&P 500. It'll be easy to see why. After being unable to move above the 20-day moving average line (blue) after four tries over the course of the first four days of last week, the bears finally gave up. For the first time in several weeks the index closed under its 50-day moving average line (purple), and more alarming than that, broke under the straight-line support level (light blue) that's been prodding the S&P 500 higher on each pullback going all the way back to March.
S&P 500 Daily Chart, with Volume
Source: TradeNavigator
Here's the same daily chart from a distance, for a little more perspective. From this view the converging wedge pattern (the light blue support line and the orange resistance line) clearly come into play, with the support side of the narrowing trading range getting some assistance from the 50-day moving average line. Also take note on this particular daily chart that the Volatility Index (VIX) is once again starting to move. Its horizontal ceiling 21.8 was tested with Friday's high, but more important than that, the VIX's falling resistance line (green) is within striking distance.
S&P 500 Daily Chart, with VIX and Volume
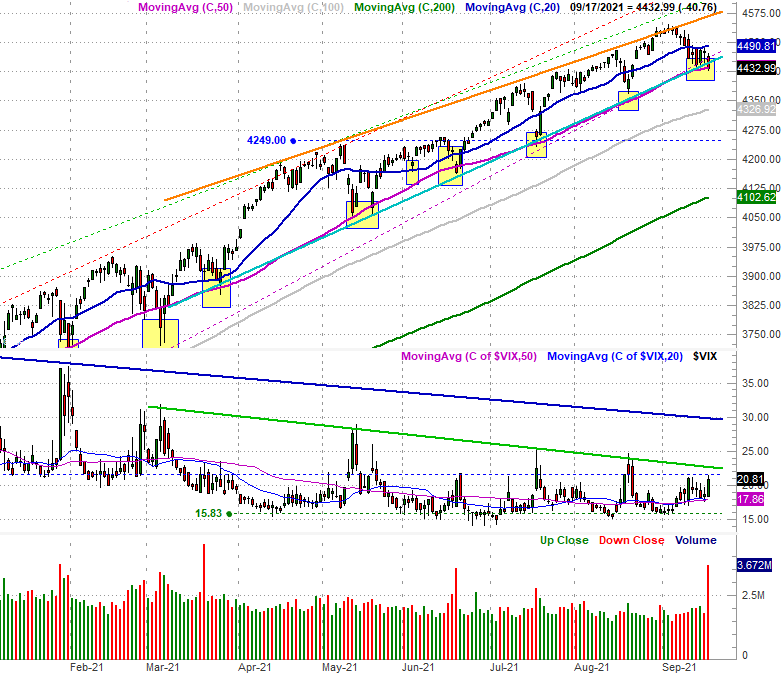
Source: TradeNavigator
This isn't necessarily damning evidence that the market is finally tipping over. Friday was also an options-expiration day, explaining the volume surge and at least some of the VIX's "up." It may also explain some of the market's "down." Then again, sometimes the pressure put on the market by options merely reflects the market's otherwise-obscured undertow.
It's still too soon to make that call. One bad day doesn't have to mark the start or end of a trend. It would be naive, however to think this overbought market isn't due a for a more significant correction than we've seen in recent months.
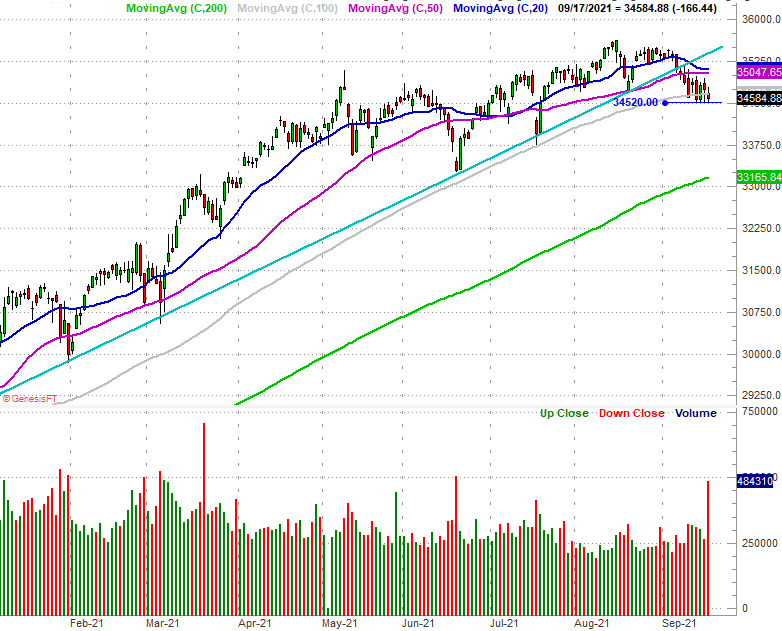
And the S&P 500 isn't the only index dropping this decidedly bearish hint. The Dow Jones Industrial Average is doing the same. Indeed, it's further along the breakdown process than the S&P 500 is. Take a look. The Dow broke under its major support line (light blue) two weeks ago, and closed under its 100-day moving average line (gray) on Friday.
Dow Jones Industrial Average Daily Chart, with Volume
Source: TradeNavigator
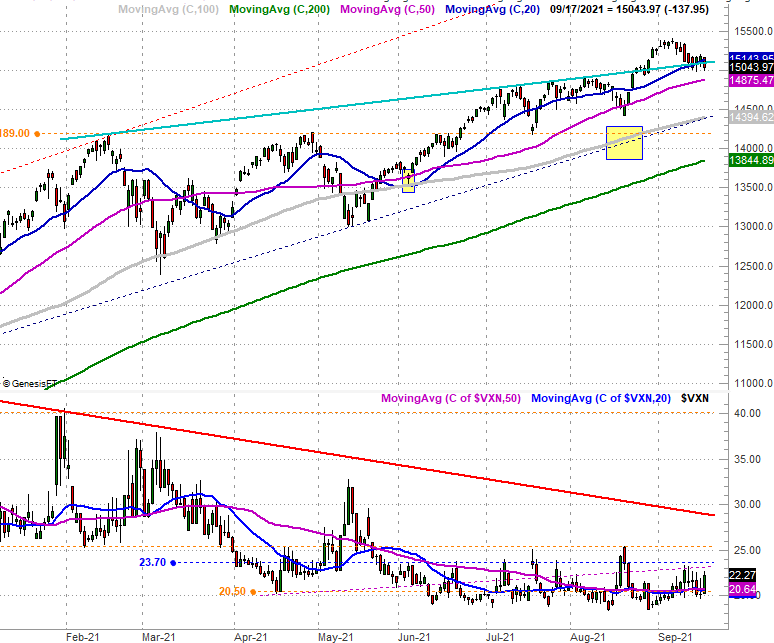
The good news is, the one index that needs to remain above its key lines in the sand -- the NASDAQ Composite -- is doing just that. Still, note that the NASDAQ's volatility index (VXN) is testing the waters of a move above some technical ceilings of its own around 23.5. It matters as the NASDAQ tends to lead the overall market... higher as well as lower. The fact that it's not leading the rest of the market under important technical floors leaves a glimmer of hope.
NASDAQ Composite Daily Chart, with Volatility Index
Source: TradeNavigator
It's important to bear in mind that Friday's options expiration day could have skewed things. In this case, that skew may have been in a bearish direction. On the other hand, that may not entirely matter. Regardless of the reason for technical damage, once the damage is done, it's done. Clearly what happens this week is going to be telling, but we need to see the NASDAQ start to crumble before we presume the worst.