Weekly Market Outlook - Choppy Bullishness is Still Bullishness
Last week ended on a bullish note, mostly in response to a surprisingly decent jobs report for January. A closer inspection of the market's daily action, though, reveals the gain was a "just barely" situation.
It was also a fairly volatile week, starting with a bearish gap but while in a bullish gap on Friday. And, most of the indices bumped into an all-too-familiar ceiling with Friday's advance. In other words, it's a bit difficult to distinguish between true bullishness and mere volatility that just happened to work in our favor.
We'll explore all the things that could still up-end the market in a moment, right after a quick rundown of last week's and this week's economic news. Like we said, January's employment numbers were very encouraging to investors.
Economic Data
Last week was an especially busy week in terms of economic news; we don't have time or room to go through all of that. We'll just hit the highlights, beginning with the most important item.... last month's jobs report from the Department of Labor.
In January, the country added 227,000 new payrolls, handily topping expectations for only 157,000 new jobs. The unemployment rate actually ticked higher, from 4.7% to 4.8%, but only because a wide swath of people joined or rejoined the labor force, anticipating the job has become much easier to secure now.
Payroll Growth and Unemployment Rate Charts
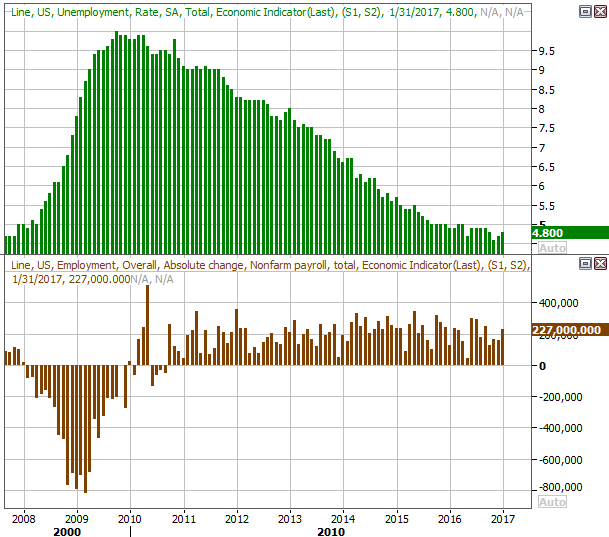
Source: Thomson Reuters
It was also a big week for ISM data. The ISM manufacturing index rolled in at 56, vs. Expectations of 55, while the ISM services index fell just a tad, from 56.6 to 56.5. Both remain in positive territory (above 50.0), which bodes well for the economy.
ISM Indices Charts
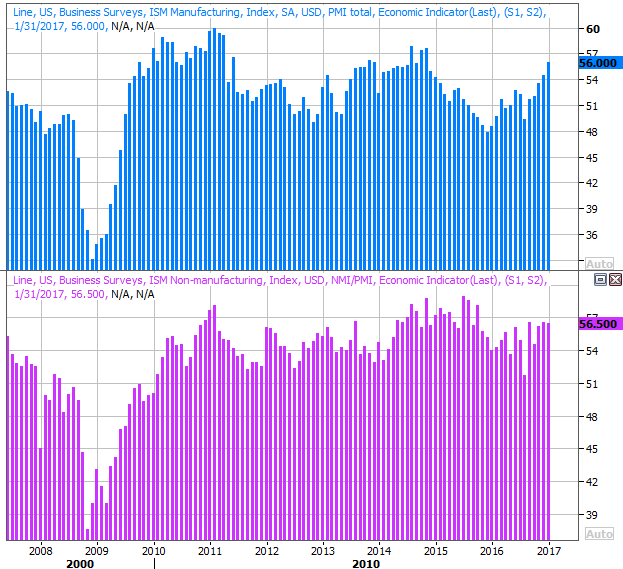
Source: Thomson Reuters
Though the pace of automobile sales last month fell compared to December's strong reading, it was still a solid month compared to the recent trend/average. Cars sold at a pace of 4.67 million, and trucks remained red hot, selling at a pace of 9.22 million.
Automobile Sales Charts
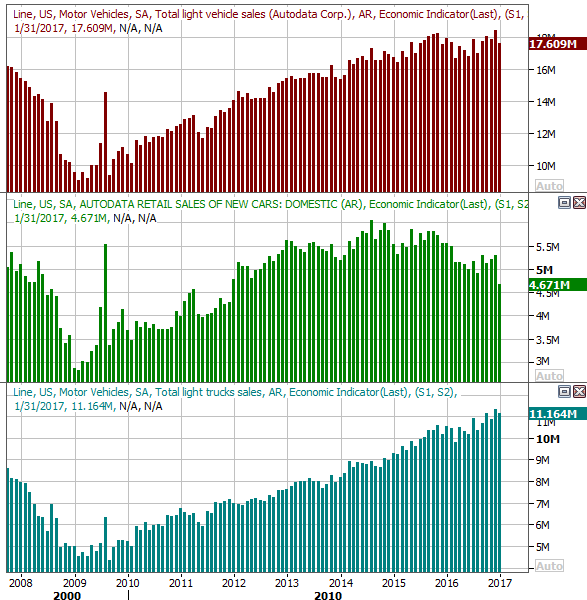
Source: Thomson Reuters
Most analysts and observers agree that even if we aren't technically at " peak auto" yet, 2017 will be a challenging year for the industry simply because 2015 and 2016 were so incredible that it's almost an unfair comparison.
Finally, the FOMC opted to not impose a rate hike last week when it had an opportunity to do so. Though the Federal Reserve acknowledges the sentiment is strong and expectations are high, it's not actually seen enough empirical evidence of economic strength to put the brakes on again just yet.
Everything else is on the grid.
Economic Calendar
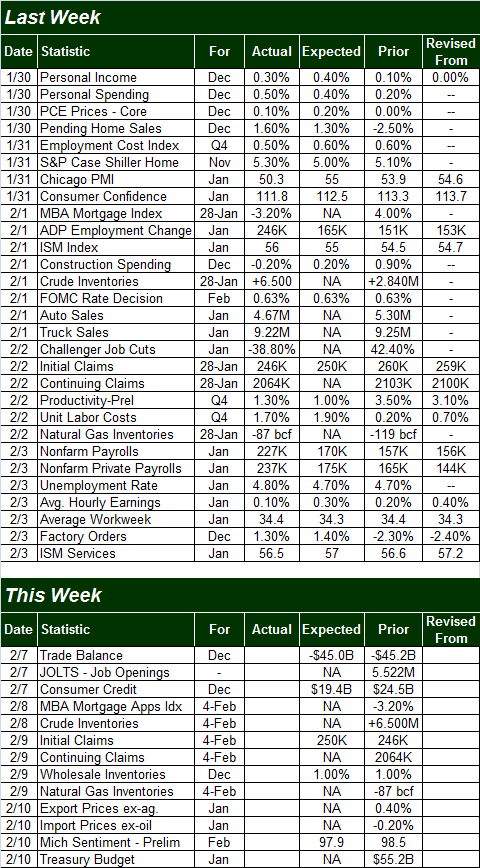
Source: Briefing.com
This week is going to be downright boring vs. last week's bevy of economic news. In fact, the only item of any real interest to us is Tuesday's JOLTS (job-opening and labor turnover survey) report. It's been cooling off a bit lately, though only after soaring to record levels early last year. Given the strong payroll growth we saw from the Department of Labor last month though, we wouldn't be surprised to see the uptrend rekindled... all part of the Trump effect.
JOLTS (Job-opening and Labor Turnover Survey) Charts
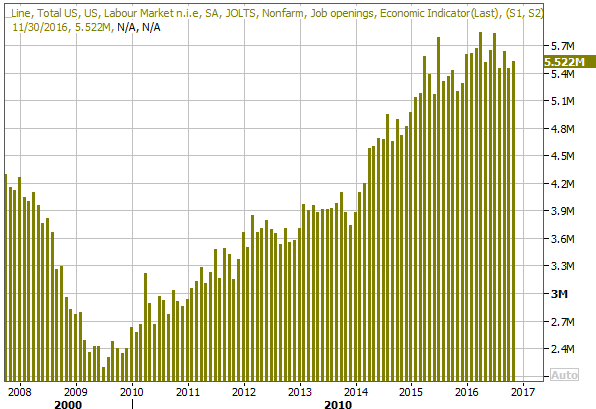
Source: Thomson Reuters
Index Analysis
As unlikely and atypical as a rally would be in these circumstances and at this point in the year, the fact of the matter is, the bulls have an edge because the underlying momentum is pointed higher. Extreme caution is advised (though it always is) but until we have a clear signal that the amazing rally since early November is rolling over, we have to assume the undertow is indeed bullish.
The good news is, there's a clear line in the sand that will mark when and where any breakdown has begun.
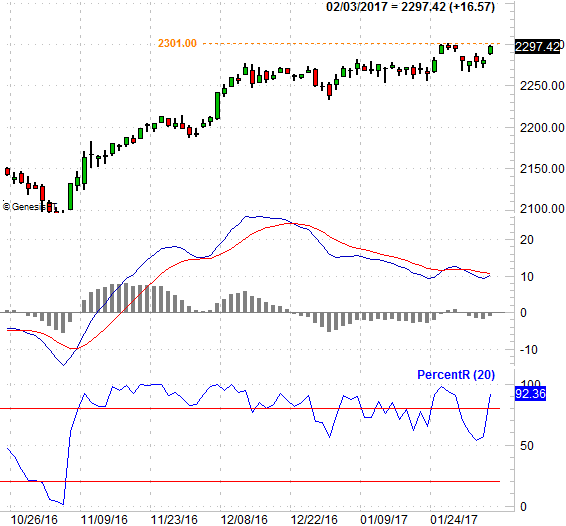
Take a look at the daily chart of the S&P 500 below. Despite the rough start to the trading week on Monday and the lethargic action during the middle three days of the week, the 20-day moving average line never failed as support, and ultimately set the stage for a bullish thrust on Friday.
S&P 500 Daily Chart
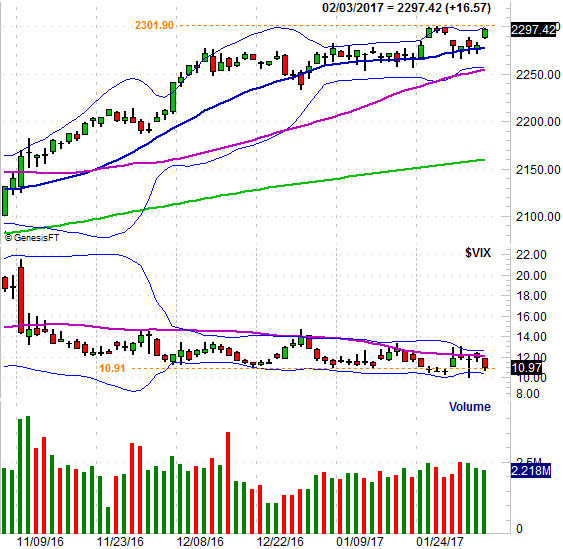
Chart created with TradeStation
There are some problems with the rekindled bullishness, however. One of them is the fact that with Friday's big jump, a gap was left behind; the market doesn't like to leave gaps unfilled. The other problem with Friday's jump was that the rally stopped just as soon as the upper 20-day Bollinger band was bumped into. The upward move also stopped just short of the prior week's high around 2301. The VIX is also back to what is more or less an absolute low, which will make it tough for stocks to tack on any more games....
.... tough, but not impossible. Indeed, as we noted, the momentum is bullish. So are two of the more critical clues we watch on a daily and weekly basis, almost.
We're talking about the PercentR line and the MACD lines. We're close to seeing a bullish divergence from the MACD indicator, and barring something catastrophic, will see it unfurl on Monday. The PercentR line is already in bullish territory by virtue of being above the 80 level. But, to confirm this bullish clue, the S&P 500 needs to move into higher-hike territory. A move above 2301 is all it will take.
S&P 500 Daily Chart, With PercentR and MACD
Chart created with TradeStation
When we zoom out to a weekly chart of the S&P 500, we can get a better feel for just how far the market has come since February of last year - it's overbought and overextended. It's also in this timeframe we can see just how amazingly and oddly low the VIX is.
S&P 500 Weekly Chart
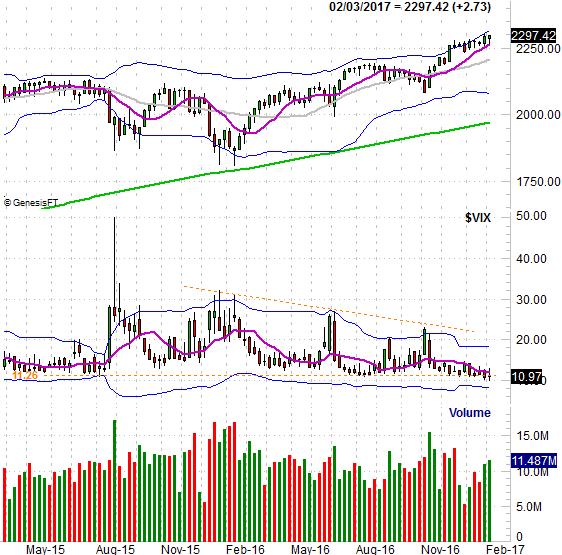
Chart created with TradeStation
That may not necessarily be enough two stop the rally this week, or even slow it down. Sooner than later though, something's going to have to give.
The clue to that end will be a break below the 50-day moving average line (purple) currently at 2255. The index's lower Bollinger band is also write their lending a helping hand. You may also recall that level was more or less where the S&P 500 found a floor during the early part of January in the middle part of December. We have to assume that support is going to hold strong, but if it doesn't and the index breaks under it, there's not going to be a lot left to stave off a selloff.
That's only a contingency plan though, at this time. Right now, as difficult as it may be to digest, the trend remains bullish... even if not red -hot or consistent.