

For a second week in a row, stocks ended the week on a low now, and near the low for the week. It’s a sign that the bulls continue to lose confidence.
They’re not past the point of no return just yet, mind you. There’s still a chance the bulls could turn things around. Given the circumstances, backdrop, and pent-up potential for profit-taking though, the bulls have a great deal to prove now if they want to keep things moving in their direction. There’s just one last line in the sand left to cross.
We’ll look at that line in a moment, but first, let’s recap last week’s biggest economic announcements and preview what’s coming this week.
Economic Data Analysis
Last week’s biggest news was of course the Fed’s decision on interest rates. As was widely expected, the Fed Funds Rate remain unchanged. The FOMC also offered the largely-expected rhetoric that leaves all options open until the next scheduled decision day in late July. The market’s betting the Federal Reserve won’t actually lower interest rates, however, until September (but those bets are pretty confident).
The party started in earnest, however, on Tuesday, with last month’s retail sales. Economists rightfully expected them to drop, but underestimated just how much they would.
Retail Sales Charts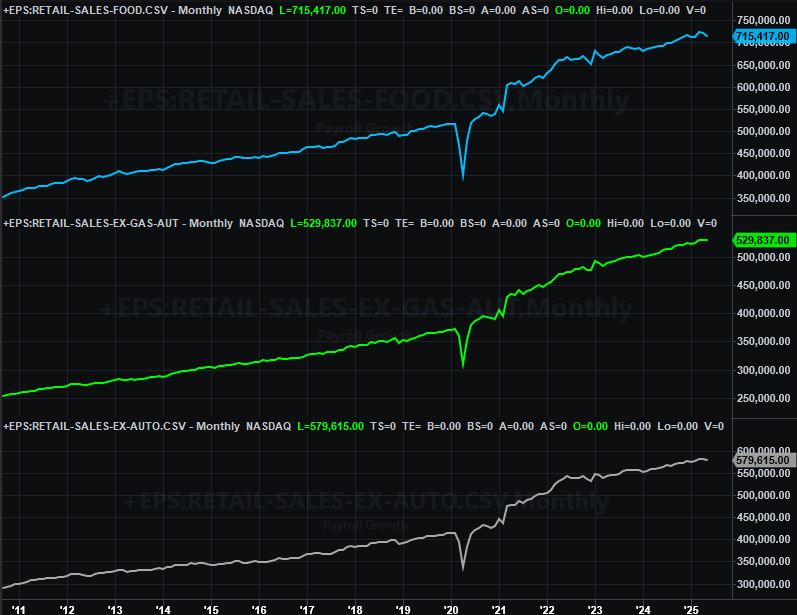
Source: Census Bureau, TradeStation
One bad month doesn’t make a trend. All trends, however, start with that first bad month. We’ll need to see a couple more like May before we can get really worried.
Also on Tuesday we got last month’s capacity utilization and industrial production report from the Federal Reserve. It wasn’t great either, and not for the first time. Both remain in a slump that first took hold in March.
Capacity Utilization and Industrial Production Charts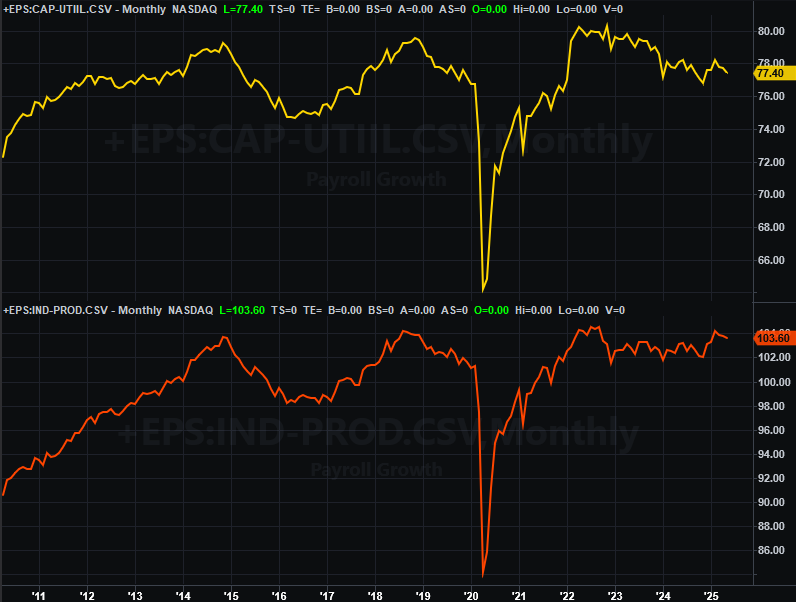
Source: Federal Reserve, TradeStation
This is a problem. As we’ve noted before, the correlation between this data and corporate earnings and the long-term market is a strong one. To see weak production and capacity-utilization numbers now suggests the market is fighting a headwind it can’t push through.
On Wednesday we heard May’s housing starts and building permits, both of which slipped from April’s levels. In fact, starts reached a multi-month low, while permits made their lowest reading since bottoming in late-2022.
Housing Starts, Building Permits Charts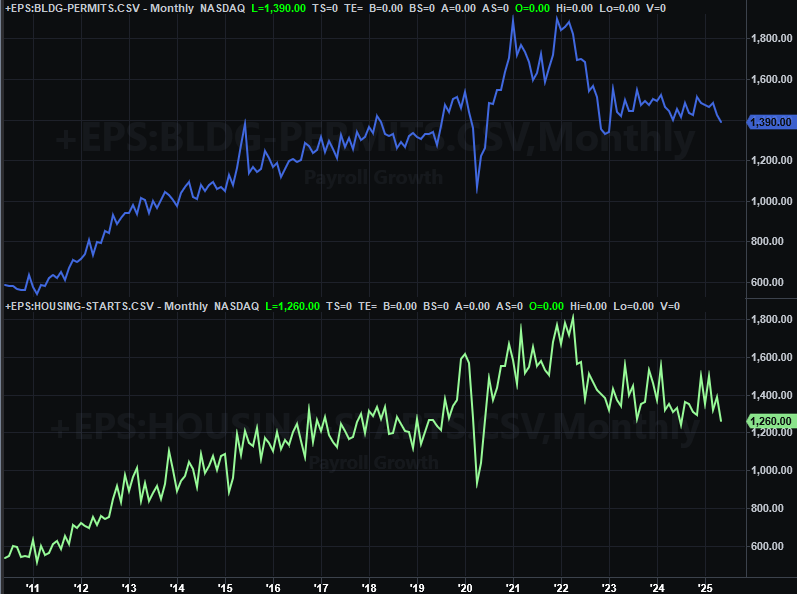
Source: Bureau of Labor Statistics, TradeStation
It’s getting difficult -- if not impossible -- to say economic malaise isn’t taking a toll on the housing market, which of course will take it’s on kind of toll on the economy.
Everything else is on the grid.
Economic Data Report Calendar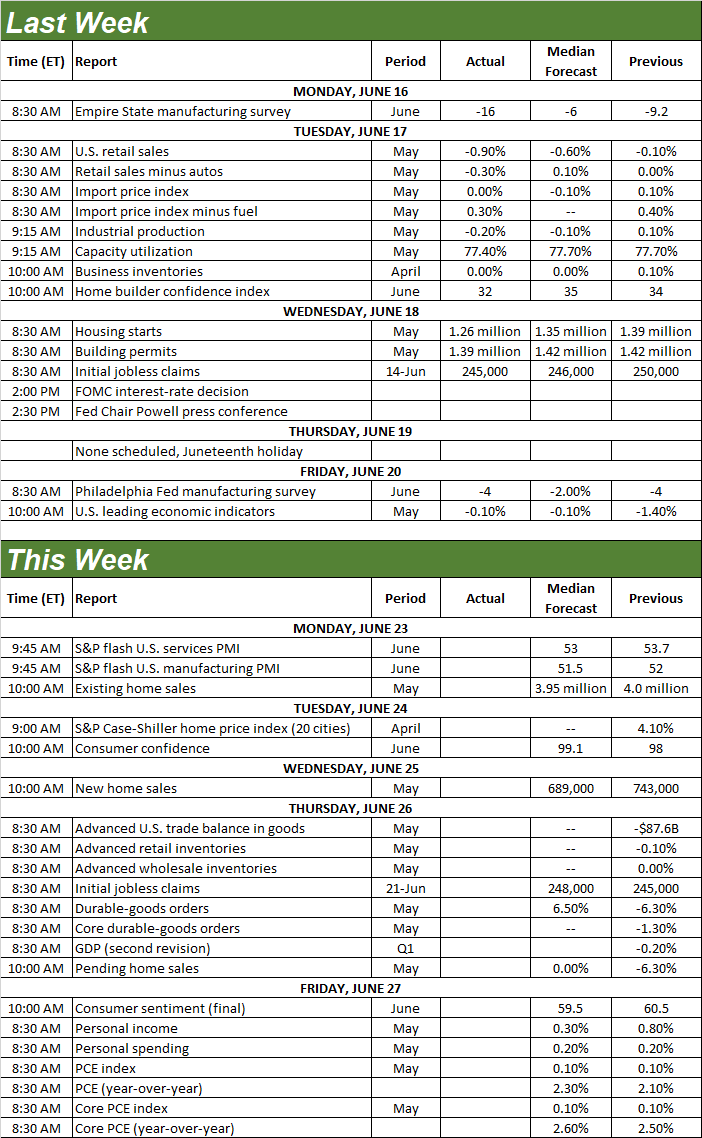
Source: Briefing.com, TradeStation
We’ll largely round out the real estate picture this week, with May’s sales of existing homes due on Monday, and new home sales coming on Wednesday. Forecasts are calling for a slight drop from both, which will extend the slow decline in sales of existing homes, and stymie the choppy recovery effort on the new-home front… but not by enough to kill it.
New, Existing Home Sales Rate Charts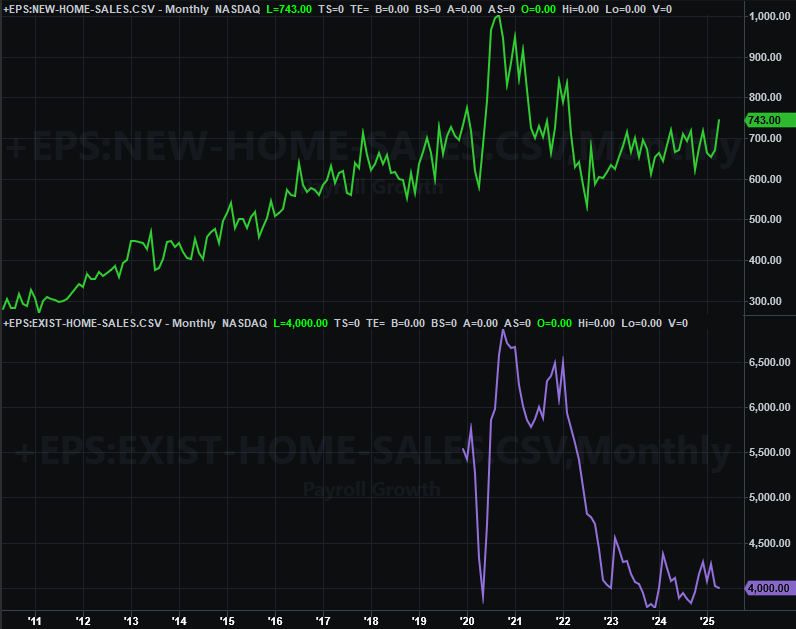
Source: National Assn. of Realtors, Census Bureau, TradeStation
Just bear in mind that one of the only reasons new homes are selling as well as they are as they existing homes are selling so poorly. That said, also know that inventory of existing homes is slowly and quietly creeping higher, reaching a twelve-month high of 1.45 million units in April. We may finally be seeing the desperate and stubborn crowd coming out of the woodwork.
That idea will be fleshed out a little on Tuesday, by the way, when we hear the Case-Shiller report as well as the FHFA Home Price Index. This has been a bit frustrating simply because the latter has been showing weakness the former hasn’t for the past few months. Although we can generally presume that’s a hint that the higher-end market’s pricing is holding up better than the lower-end is, there’s no assurance this will remain the case in light of the loosening that seems to be taking shape now.
Home Price Charts 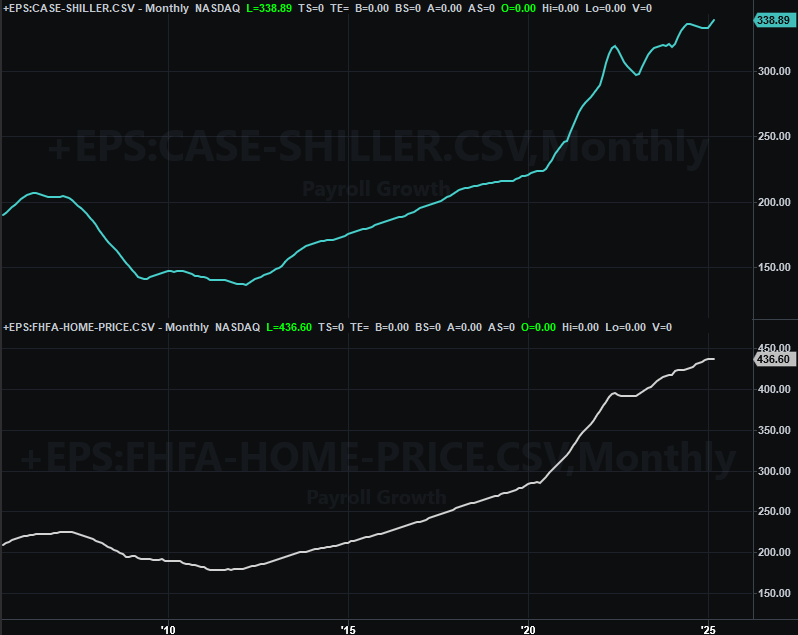
Source: FHFA, Standard & Poor’s, TradeStation
Just bear in mind that both home price reports will be fore April rather than May, and much changed in between those months. Don’t jump to any huge conclusions based on the home price data reports alone.
The consumer confidence snapshot will also help is figure out what’s really going on here. The Conference Board’s report is due on Tuesday, while the third and final look at June’s consumer sentiment score is coming on Friday. You may recall that both edged a little higher in May, but only after terrible Aprils. Economists expect another modest improvement for June.
Consumer Sentiment Charts 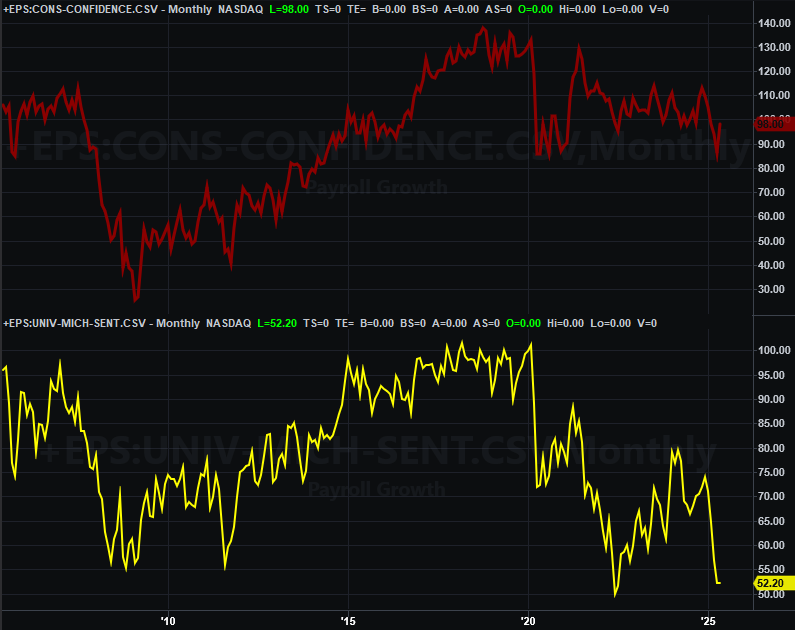
Source: Conference Board, University of Michigan, TradeStation
Finally, also on Friday we’ll hear about May’s personal income and personal spending changes. This is the data the Federal Reserve considers first and foremost when making decisions regarding interest rates. Be sure to keep your eyes and ears open for these numbers, particularly in light of all the current uncertainty.
Stock Market Index Analysis
In retrospect, we can see the market may have actually peaked two weeks ago. We saw a lower low and a lower high from the S&P 500 last week, and of course, logged a slightly lower close. The index is also putting some significant pressure on its 20-day moving average lines at 5,957 (plotted in blue on the daily chart of the S&P 500 below). The S&P 500 brushed it on Friday. Although it’s not under it, it didn’t exactly push up and off of it either.
S&P 500 Daily Chart, with VIX and Volume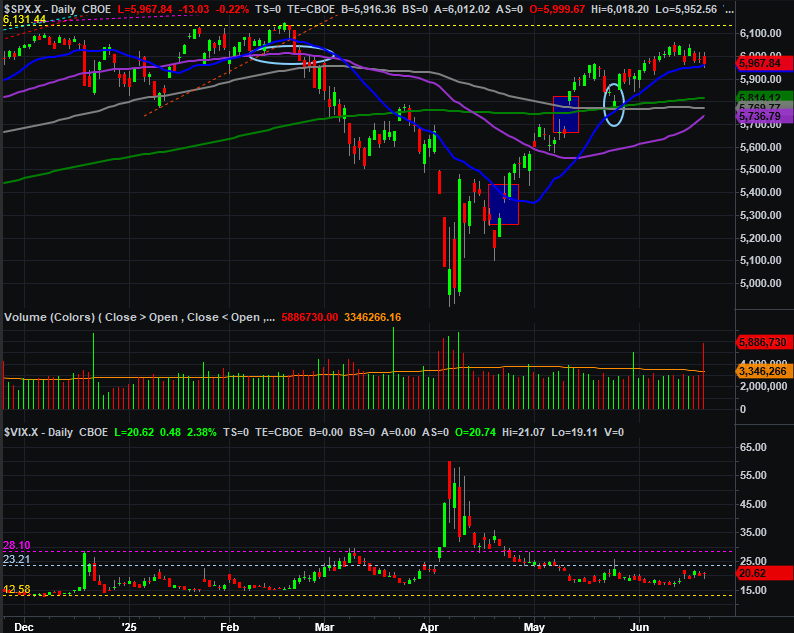
Source: TradeNavigator
The NASDAQ Composite is doing the same thing, and for a far more specific reason. That is, two weeks ago it bumped into a falling technical resistance line (orange, dashed) that first materialized in December, and has now prevented the index from moving any higher on four separate occasions now (downward-pointing red arrows).
NASDAQ Composite Daily Chart, with VXN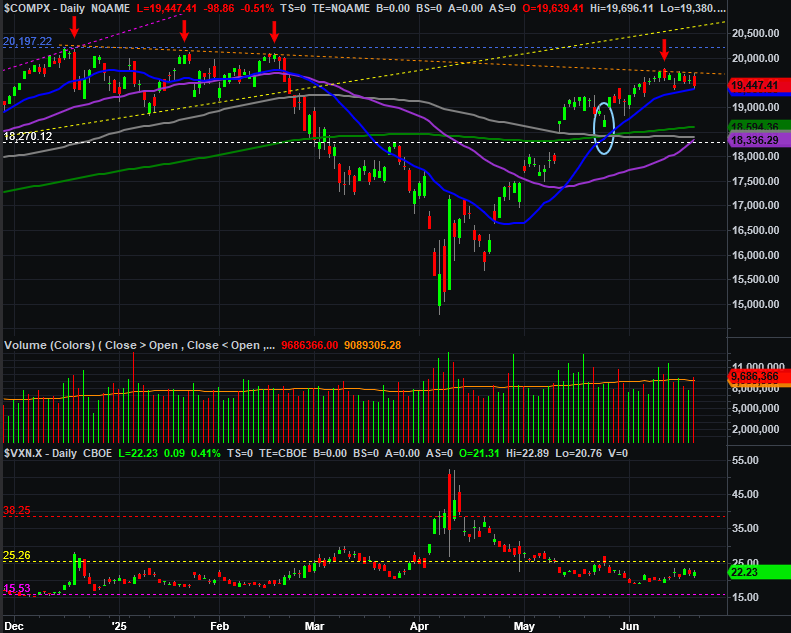
Source: TradeNavigator
The weekly chart of the NASDAQ Composite puts this ceiling in a little bit more perspective, along with the last couple weeks’ worth of weakness. In both cases the index ended up closing near the low for the week (both of which were made on Fridays). This suggests traders are decreasingly committed and confident, opting to not take their long position into the weekend. Then again, after a 30% gain in just ten weeks, fears of a profit-taking pullback are certainly understandable.
NASDAQ Composite Weekly Chart, with VXN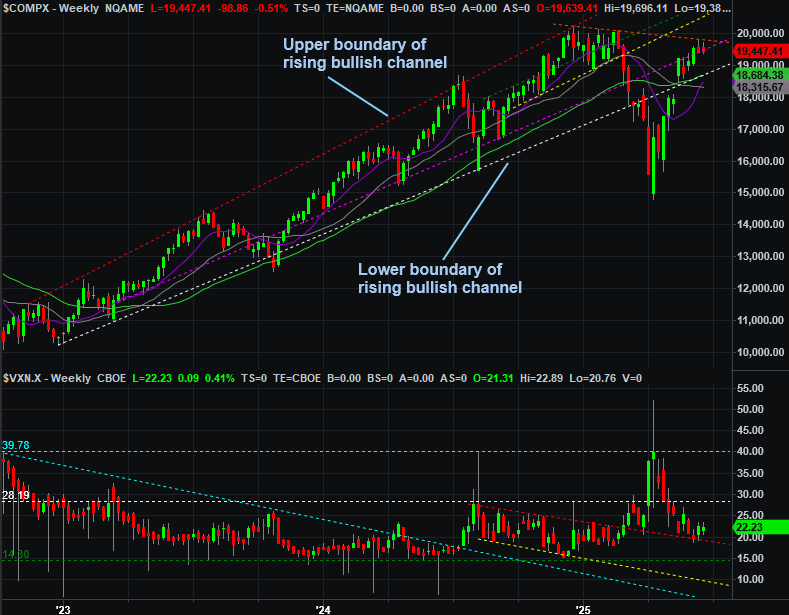
Source: TradeNavigator
All that being said, don’t read too much into any pullback talk. The fact is, it’s entirely possible stocks will fall just a little -- but not a lot -- and rekindle the rally that materialized in April.
Go back up to the daily chart of the S&P 500 and notice how all the other moving average lines are close to converging at 5,780; the 20-day moving average is the outlier here. This narrow band should serve as a strong technical support level if-and-when tested even if the 20-day line does end up buckling as a floor. Indeed, a small setback here might actually be the best thing for the bulls in the long run, letting off much of the pressure of being so overbought at this time.
That being said, should the converged 20/100/200-day moving average lines fail to hold up as a floor and allow a more prolonged selloff to take hold, we’re also then going to be looking at the volatility index (or VIX) at the bottom of the S&P 500’s daily chart. It looks like it’s about to test a ceiling at 23.2, while another ceiling right above that one at 28.1 could also soon come into play. As long as at least one of those keeps the VIX contained, the bulls have a fighting chance. If the resistance at 28.1 (purple, dashed) is broken though, it will likely coincide with a breakdown from the S&P 500 itself, opening the selling floodgates.
For now, the best move to make is not making a move at all. Let’s let nature take its course and then respond, particularly in light of all the uncertainty surrounding tensions in the Middle East.