Weekly Market Outlook - A Lousy End to the Week Isn't a Major Bearish Concern (Yet)
The bulls were on a roll all week long, until Friday, when the effort largely unraveled. Thanks to its 0.9% tumble on the last day of the week, the S&P 500's 3.8% intraweek gain was dialed back to only 2.5%... and ended the week on a bearish foot.
It's too soon to assume or fear the worst though. In fact, as we commented Thursday evening, a modest break from the rally and even a pullback might actually be the best thing for the rally itself. Rather then letting it get too overheated and kick-starting a major wave of profit-taking, we're starting the new week with a relatively clean slate, and a good opportunity to move in either direction. Notably, the indices are still above all the technical resistance levels that were hurdled earlier in the week.
We'll look at the specifics below, as we always do. First though (and also as we always do), let's look at last week's major economic announcements and preview what's coming this week.
Economic Data Analysis
We heard several economic reports last week, but all of the big ones were about real estate... and none of it was encouraging.
The first of it came on Tuesday, when the Census Bureau released last month's housing starts and building permits numbers. Both came in right around expectations, and near May's levels. But, May's starts and permits are at the low end of the long-term uptrend's range.
Housing Starts and Building Permits Charts
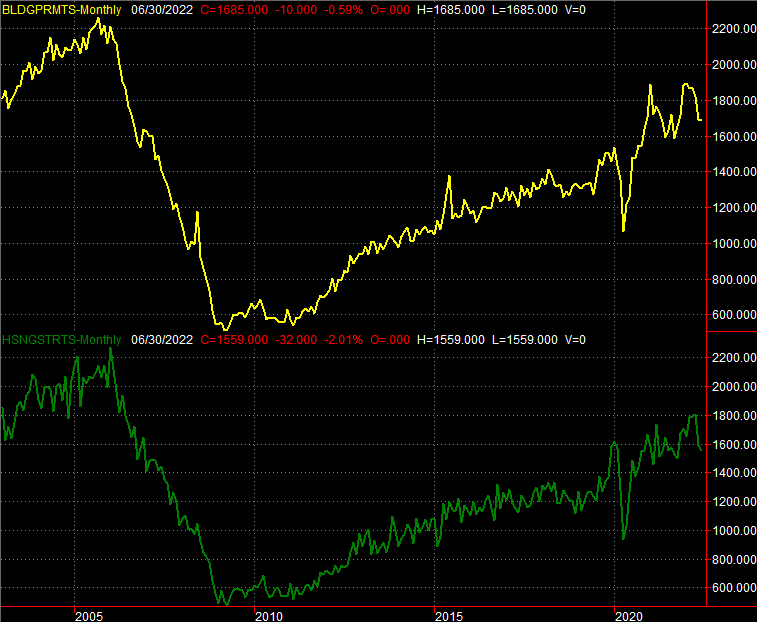
Source: Census Bureau, TradeStation
Were that the only misstep, it might be dismissible. It wasn't the only misstep for real estate though. Sales of existing fell pretty significantly from May's levels, which were already down significantly from April's report. In fact, last month's annualized sales pace of 5.12 million houses is the slowest we've seen since May of 2020, when the pandemic had effectively shut everything down.
New and Existing Home Sales Charts
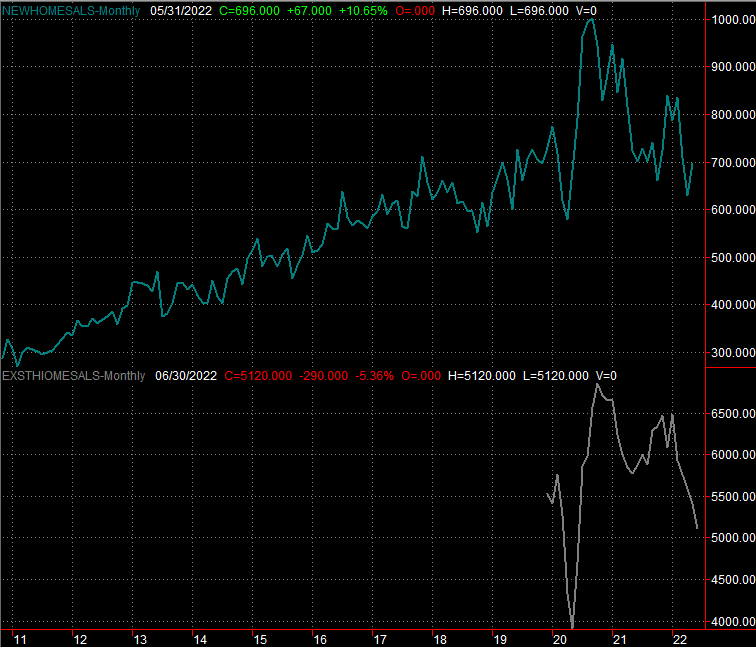
Source: Census Bureau, National Association of Realtors, TradeStation
We'll round out this data this week on Tuesday with a look at last month's sales of new houses. Economists aren't hopeful, however, forecasting an annual pace of only 670,000 homes, down from May's reading and nearing the lowest reading of 629,000 since the pandemic began. That was in April of this year. Clearly there's a slowdown taking shape here.
Everything else is on the grid.
Economic Calendar
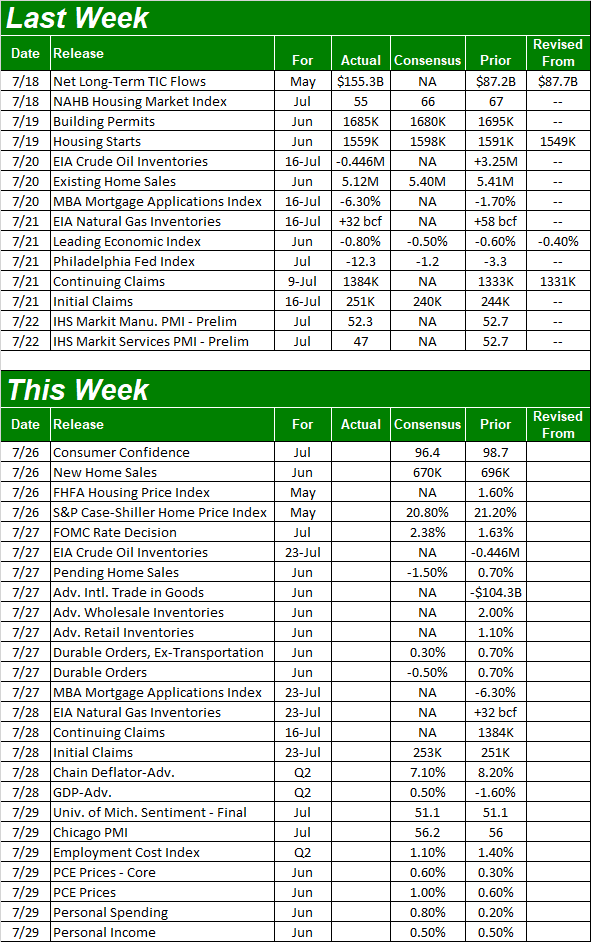
Source: Briefing.com
This week is going to be a big one, for a bunch of reasons. The biggest of these is Wednesday's decision from the Federal Reserve regarding interest rates. The FOMC is expected to raise the Fed Funds Rate between 3/4 of a point and one full point; either will certainly spark a response from investors.
That's not the only news on the calendar for this week though. We're still rounding out the look at real estate, with home price data scheduled for Tuesday. Both the Case-Shiller index as well as the FHFA Housing Price Index are projected to show more forward progress. Just bear in mind that these numbers are ONLY based on the average price of a sold home without any regard to how many are sold. Also keep in mind that these numbers will be for May. Much has happened (for the worse) since then.
Home Price Charts
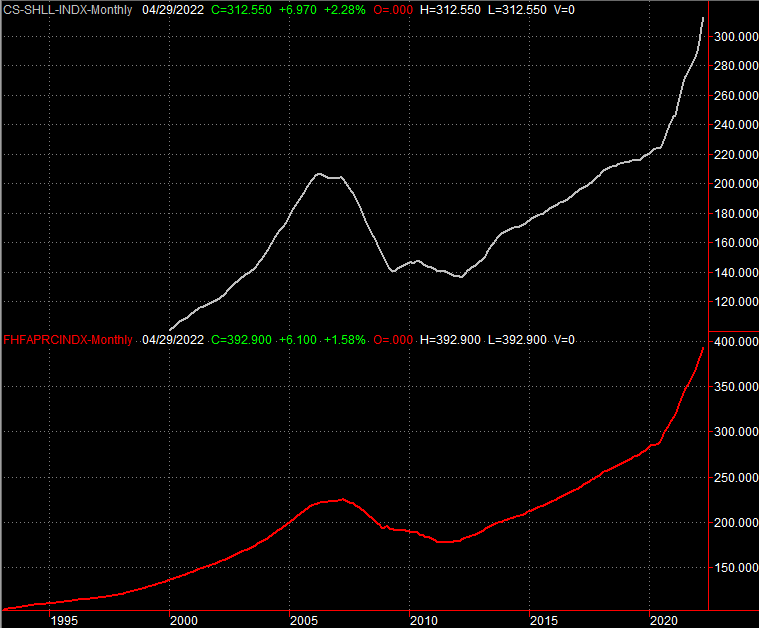
Source: FHFA, Standard & Poor's, Case-Shiller, TradeStation
It's also a big week for sentiment, which of course has been deteriorating. The Conference Board's consumer confidence score will be posted on Tuesday, while the third and final reading for July's sentiment measure from the University of Michigan well be dropped on Friday. Both are still likely to come in at rock-bottom levels, though only the Conference Board's data is expected to roll in lower than June's print.
Consumer Sentiment Charts
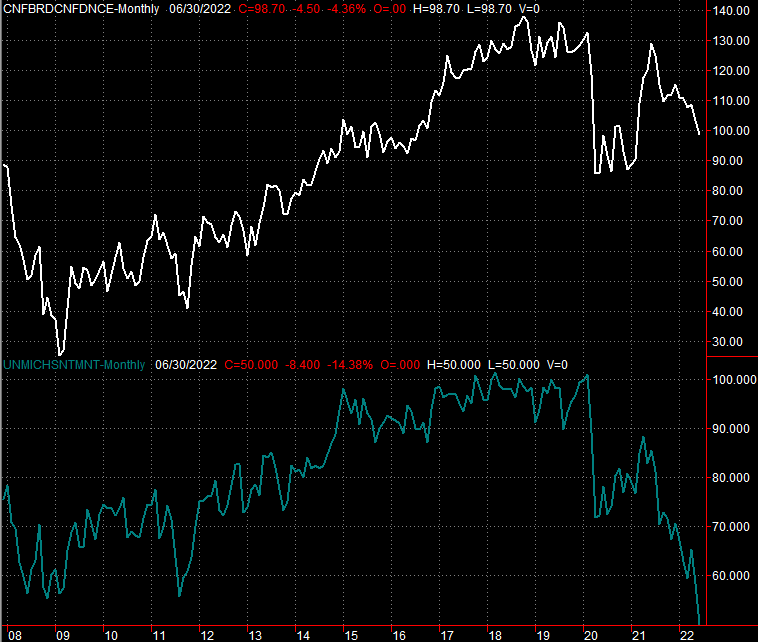
Source: Conference Board, University of Michigan, TradeStation
There's no chart of it here, but also prepare for the first guesstimate of Q2's GDP growth on Thursday. The current consensus is for modest growth of 0.5%, reversing Q1's 1.6% decline. The range of estimates is all over the map though, with several calling for another contraction.
Stock Market Index Analysis
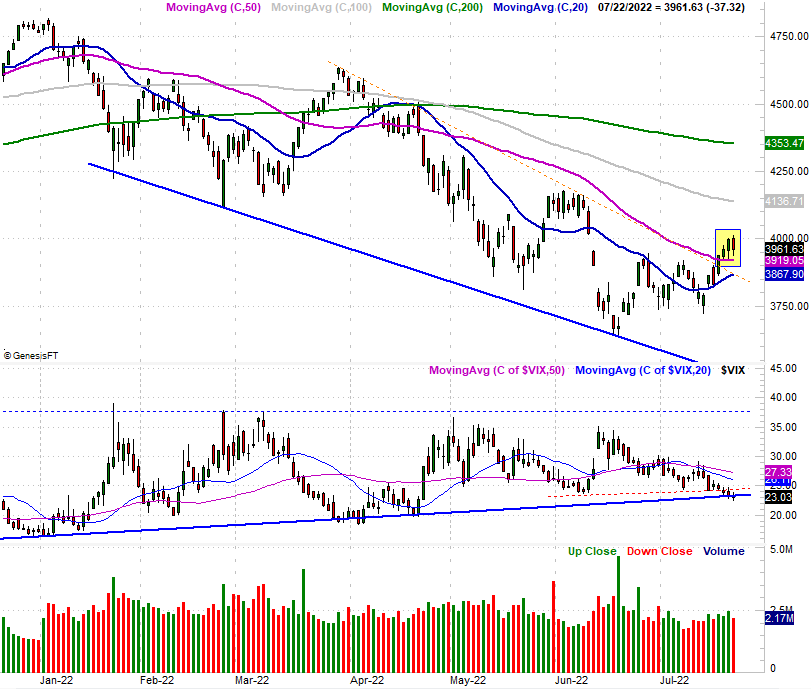
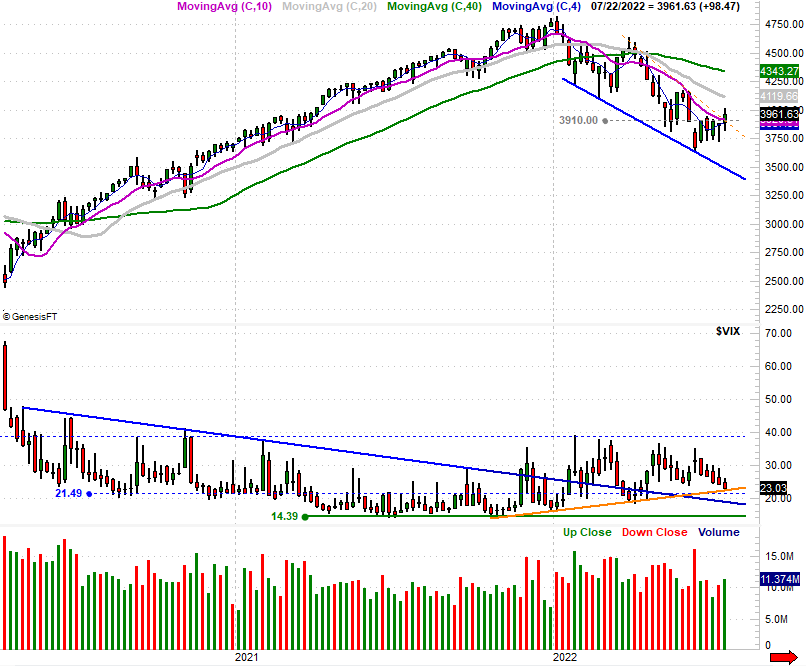
We start this week's analysis out with a zoomed-in view of the S&P 500's daily chart, just to make clear how far the market came last week. Although it was losing a fair amount of ground on Friday, it still ended the week above the 50-day moving average line (purple) it hurdles on Tuesday, and also cleared the major resistance line (red, dashed) that had been capping bullish efforts since March. That's huge.
S&P 500 Daily Chart, with VIX and Volume
Source: TradeNavigator
Don't celebrate prematurely. There's something else. The S&P 500's volatility index (VIX) didn't fall as far as the bulls would have liked. It's instead still finding support right at the technical floor (blue) that's kept it moving upward since January. It's suspicious to see the VIX stop right at that line rather than push all the way under it. Either way, with the VIX right at this pivot point, stocks could still go either way.
Underscoring this indecision is an identical shape from the NASDAQ Composite's volatility index (VXN). It's testing its long-term floor (green, dashed) as of Friday, but hasn't yet broken under it. Maybe it won't. Maybe it will push up and off of it instead... which is bearish for the market.
NASDAQ Composite Daily Chart, with VXN
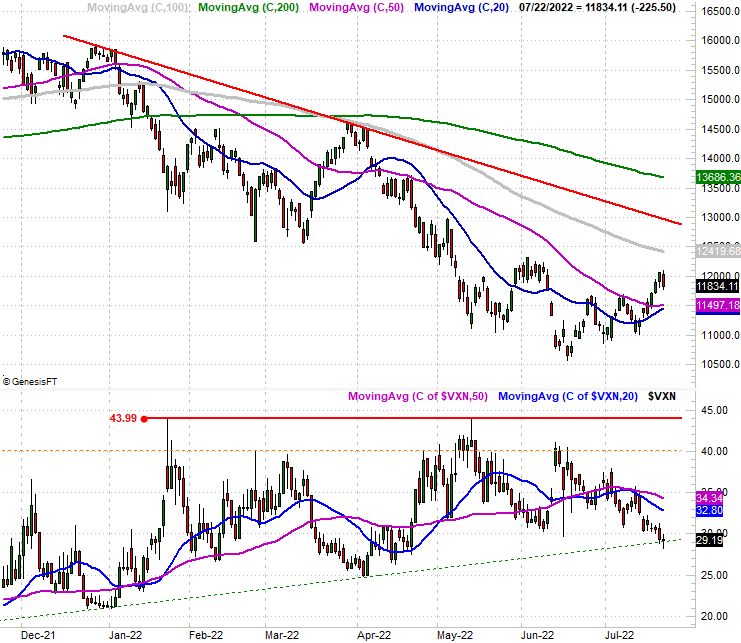
Source: TradeNavigator
Zooming out to weekly charts, however, slightly bolsters the bullish case.
You may remember last week we pointed out how both indices had been "boxed in," meaning both the S&P 500 as well as the NASDAQ Composite had spent the last few weeks trapped under a horizontal technical ceiling, yet above a technical floor. Both ceilings were clearly broken last week. As the weekly cart of the NASDAQ shows, the composite pushed past the hurdle at 11,632.
NASDAQ Composite Weekly Chart, with VXN

Source: TradeNavigator
And, the S&P 500's horizontal ceiling at 3910 was also breached, signaling a clear bullish thrust.
S&P 500 Weekly Chart, with VIX and Volume
Source: TradeNavigator
Again though, both the VIX and the VXN have yet to fall under their key technical floors that would coincide with a firm bullish breakout move from the market itself. The weekly charts also both show us that, for all the work that was done last week, both indices still have a thick, tough band of potential resistance lines above then to push through. That reality -- coupled with the fact that July and August are typically tepid months for the market anyway -- continues to make any bullishness here a bit suspect.
Let's see how the coming week shakes out before saying any more than that.