Weekly Market Outlook - A Huge (But Hollow) Victory for the Bulls
That was impressive. The S&P 500 soared 3.8% last week, logging the biggest weekly gain since August. As far as forward progress goes though, this is the last way you'd like to see in unfurl. Not only are there several gaps left to fill in (with pullbacks), volume on the way up was light, and waned with each day's progress. This isn't an indication of how most traders feel. This is just a sign that the bears and sellers didn't feel like getting in the way.
We'll weigh the odds of more upside below. First though, let's recap last week's big economic announcements and take a look at what's in store for this week. Warning: There's a LOT of economic news that could rattle stocks this week.
Economic Data Analysis
Very light week last week. In fact, the only item of real interest was the services side of the monthly ISM data. It was up, contrary to expectations for a slight lull. The ISM Services Index edged higher, from 56.9 to 57.8. Any score above 50 is a positive one, but to see forward progress given the environment is particularly encouraging.
ISM Manufacturing, Services Index Charts
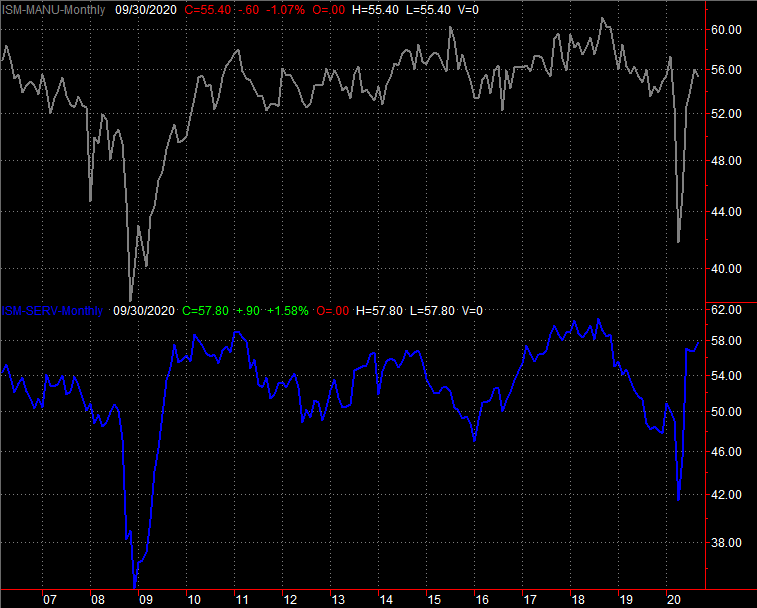
Source: Institute of Supply Management, TradeStation
Everything else is on the grid.
Economic Calendar

Source: Briefing.com
This week is going to be loaded. Buckle up.
The party starts in earnest on Tuesday, with the first looks at last month's inflation. Forecasters says it's moderated a bit, but is still positive. The annualized consumer inflation rate now stands at 1.3%.... healthy, in that it's neither too hot nor too cold.
Consumer, Producer Inflation Charts

Source: Bureau of Labor Statistics, TradeStation
Friday will be an especially busy day, with last month's capacity utilization and industrial production figures due along with September's retail sales.
Industrial output and usage of the nation's factory capacity are expected to move higher again, albeit at a slower pace. The pace of that rise isn't nearly as important as the direction things are moving though. It could be some time before we reclaim the levels seen before COVID-19 impacted... everything.
Capacity Utilization, Industrial Productivity Charts
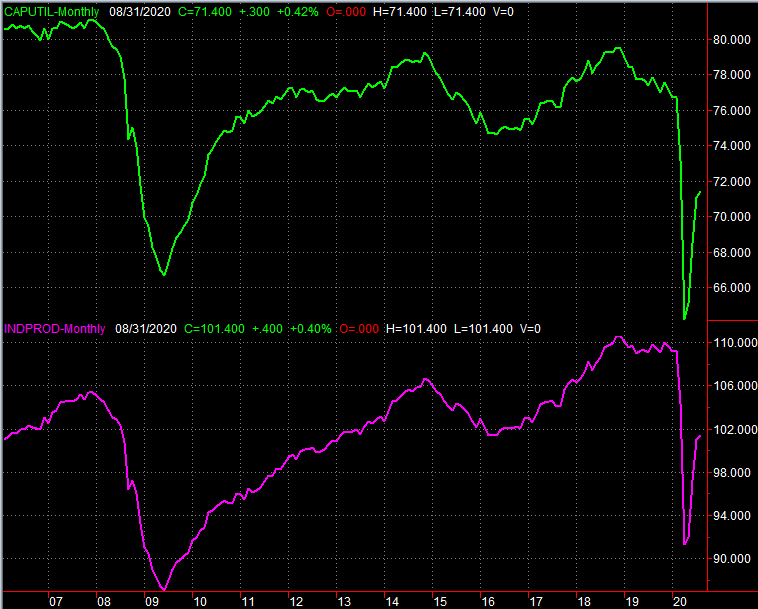
Source: Federal Reserve, TradeStation
Ditto for retail consumption. That is, economists are modeling another month of consumer spending growth, but at a slower pace than we saw in August. As was the case with industrial output though, the trajectory is more important than the raw amount of money spent. Circumstances are making it very tough to spend, but most consumers are finding ways to so do anyway.
Retail Sales Charts
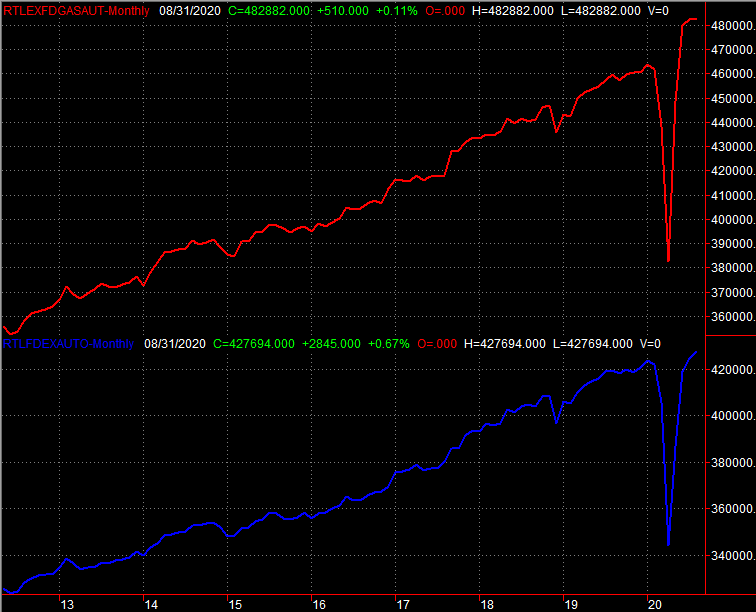
Source: Census Bureau, TradeStation
Stock Market Index Analysis
We'll start this week's analysis with a look at the weekly chart of the S&P 500, just for perspective. It was not only the best week since August, but seemingly came from nowhere.
S&P 500 Weekly Chart, with VIX
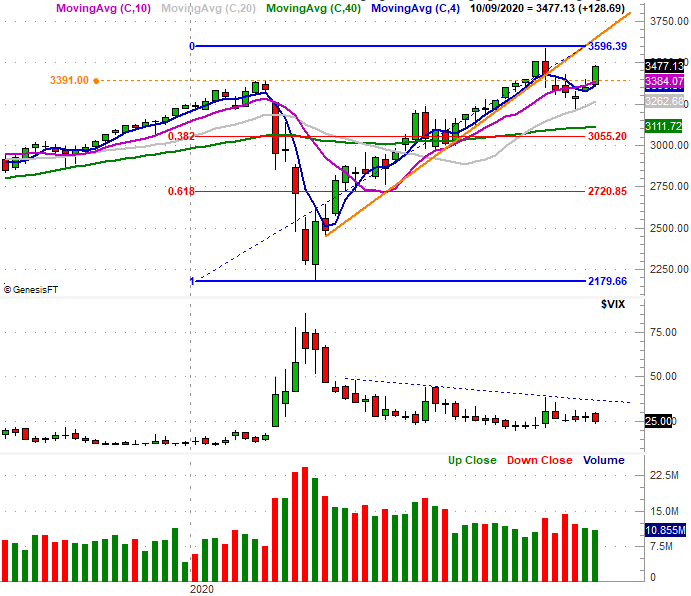
Source: TradeNavigator
Except, maybe it wasn't completely out of nowhere. Three weeks ago the index made a doji bar after kissing its 100-day moving average line (gray), both of which could set the stage for bullishness. There's also no denying the bigger trend is bullish. It has been since April.
Problem? There was little volume behind the big gain. In fact, what little volume we're seeing is waning on the way up.
This is evident in the weekly timeframe, but more evident - and more alarming - on the daily chart below. There's something else worth noting of the daily chart as well... on Thursday as well as Friday we left behind opening gaps that now may see pressure for backfilling. There's another gap around 3323 left behind in late September that's aching to be filled.
S&P 500 Daily Chart, with VIX and Volume
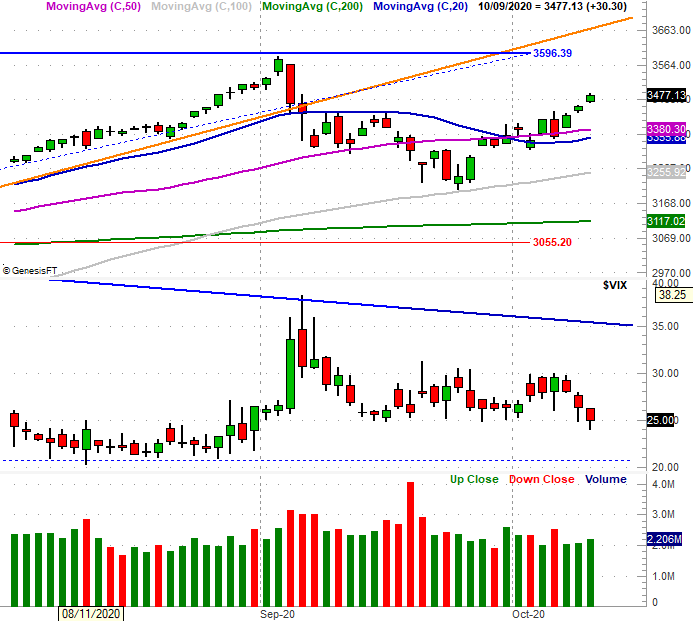
Source: TradeNavigator
Another curious nuance: While the Volatility Index, or fear gauge, moved lower last week as stocks edged higher, the shape of Thursday's and Friday's bar is telling. Each has a long tail, or fairly deep low, suggesting the VIX was actually moving back up as each day's trading came to a close. This subtly hints of bearishness, even though the S&P 500 index itself didn't drop a correlating hint. You'll also see the VIX is once again within reach of its more absolute floor near 20.0.
This open the door to one possibility worth mentioning. That is, though the odds (and calendar) are somewhat against it, the index has a shot at running back up to its early September peak around 3596 while the volatility index slides to 20, setting up a pullback.
The other possibility, of course, is that the rally is already out of gas. Even if that's what looks like is happening as we start this week though, don't jump the gun. The 20-day (blue) and the 50-day (purple) moving average lines could both act as technical floors and keep any selloff from going anywhere. Of course, if those two moving averages don't hold up as support, the 100-day moving average line (gray) still could.
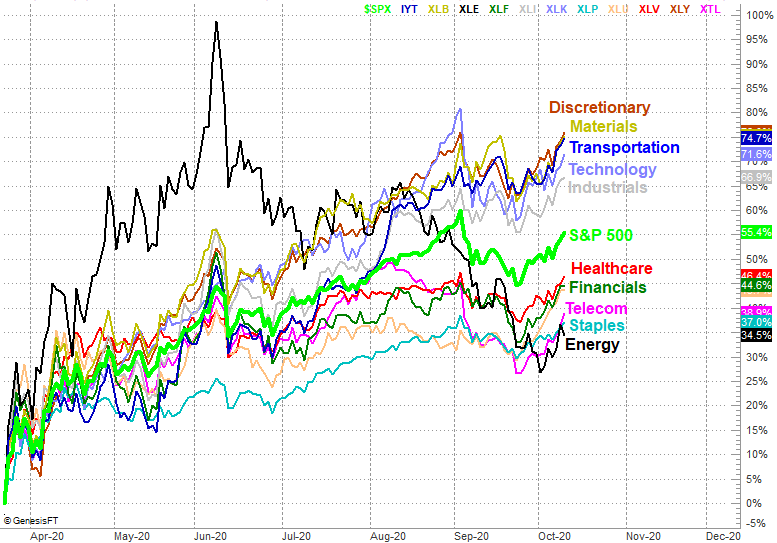
On other fronts, the usual suspects - technology stocks - aren't necessarily leading the charge of late. That honor belongs to discretionary and transportation names (although something lit a fire under financials last week as well).
Sector Performance Comparison Chart
Source: TradeNavigator
The market's rising tide did most of this work, except for energy, which has given up the bulk of its April/May gain. Of course, if the marketwide tide goes out again this week, it's going to pull most of these groups out with it. It's just interesting to see some new leadership. It's also an image worth reviewing because the leaders of late are also subject to the most profit-taking potential, while laggards like financial stocks and telecom names and even staples have some room and reason (being defensive names) to run even if the current rally crumbles. Just bear in mind that no sector completely escapes the marketwide trend.