Using StockTwits & Twitter As A Sentiment Technical Indicator
Using StockTwits & Twitter As A Sentiment Technical Indicator
Calculating Sentiment from the StockTwits Stream
We've been running our algorithm to quantify the text of tweets against the messages on the StockTwits stream for about a month now and we've finally collected enough data that I can make a few observations. Been running data analysis on the Twitter stream for longer.
Before I go into what I'm seeing on the StockTwits stream here's a little detail about how we score the messages on StockTwits and tweets from Twitter. The underlying theory is that Twitter and StockTwits provide a big enough sample set for market indexes and actively traded stocks that when quantified it should reflect the views of the market as a whole. Our computer system reads the stream and quantifies the text of each message in an attempt to determine how bullish or bearish an individual is for a specific security or market index. To score individual tweets and messages we look for things like buying and selling patterns, technical indicators, future predictions, and language that indicates either a bullish or bearish bias. The system gives more weight to what we consider to be more relevant.
Unfortunately, I named the indicator "sentiment" so the first thing everyone thinks is "contrary indicator". However, the theory and design is an attempt to build a confirming indicator similar to RSI or MACD. What I've found most useful for confirming the direction of a stock or index is the trend of sentiment. At this point, I only have enough data from StockTwits to make observations about the short term trend...so here goes.
On the chart of the S&P 500 Index (SPX) below I've put the daily StockTwits indicator (sentiment) in the top panel. The daily indicator is an aggregation of all the individual messages with a bit of math thrown in to put it on a scale of -1 to +1. Then next panel is the intensity scores (volume, intensity of language, and relevance) on a daily basis. The third panel is daily sentiment smoothed with a 7 period moving average and the fourth panel is intensity over 7 days.
SPX Chart
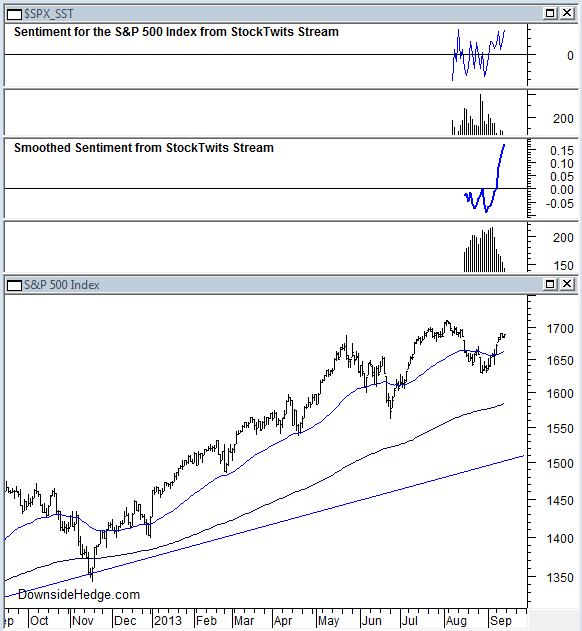
This chart is a couple of weeks old, but used for example. Daily sentiment from StockTwits has readings above zero that started a few days before SPX cleared its 50 day moving average, which is an encouraging sign for a longer term uptrend because it means people were posting bullish messages before the index cleared resistance. Smoothed sentiment broke sharply higher on the same day as SPX broke above its 50 dma. This reinforces the idea that positive sentiment was building before the clear break higher. Then, smoothed sentiment continues to move up even though SPX has stalled for a few day. At the same time the intensity of the messages fell sharply. This indicates that the bears are getting quiet rather than a battle between bulls and bears with the bulls winning. When I see this happen with tweets it usually means a slow drift higher to a resistance point before activity picks up again.
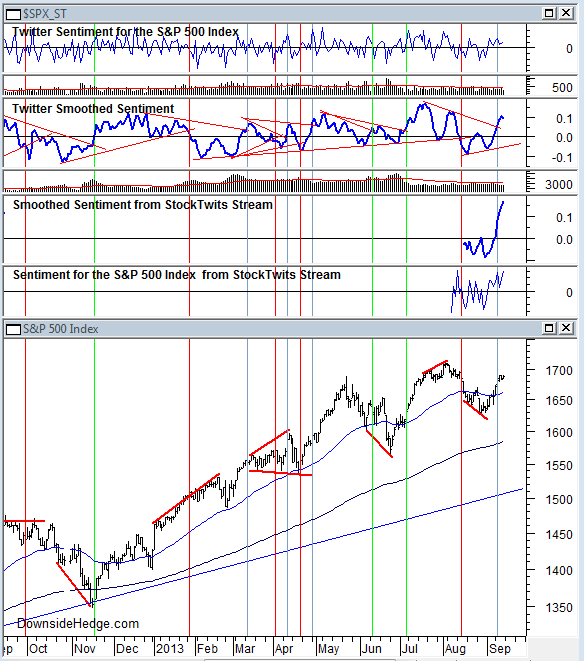
I've also put together a chart that shows sentiment from the Twitter stream and sentiment from StockTwits for comparison purposes. Twitter sentiment (smoothed) cleared its consolidation warning on the same day as StockTwits sentiment moved sharply higher and above zero. StockTwits was much more positive about the future than Twitter based on increasingly higher daily and smoothed sentiment, while Twitter posted tepid daily readings and smoothed sentiment turned down. StockTwits indicates that the market will drift higher while Twitter is showing the first signs of a pause in the market. It will be interesting to see if the two indicators paint similar patterns over time or if one community tends to be more accurate than the other.
SPX Chart
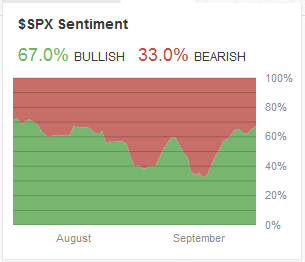
The official StockTwits sentiment for $SPX shows a similar pattern as what DownsideHedge calculated from the text of the messages (without the StockTwits bullish/bearish indicator). One difference is that the text scores (smoothed sentiment) was moving sharply higher and well above its last peak, while official StockTwits sentiment has only moved slightly above its last peak. Only time will tell if sentiment based on the text with weight given to relevance and intensity paint similar or different patterns than a straight bullish/bearish vote.
Courtesy of DownsideHedge.com