Tuesday's Intramarket Action Confirms Traders Are (Finally) Entertaining Doubts About the Rally

-- Just bear in mind that the market's not suffered any damage yet that it can't shrug off to rekindle the uptrend --
We've seen the market stumble more than once since last March's low. But, each time it's been able to pick itself back up before things got too bad. This time, however, could be different.
There are a couple of clues leading us to this possibility, one of which is the NYSE's bullish and bearish volume, as well as the NYSE's daily advancers and decliners.
The chart below should be a fairly familiar one to regular BigTrends readers. From the top down we're looking at the S&P 500, the NYSE's advancers ($ADV), decliners ($DECL), bullish volume ($UVOL), and bearish volume ($DVOL). Each of the latter four data sets also has a moving average line (blue) attached to it so we can - more or less - spot a trend. It's crystal clear that the number of advancers and the amount of bullish volume is waning at the same time bearish volume and daily decliners are on the rise. Curiously, this dynamic started to take shape before the market itself bumped into a headwind on Tuesday.

The thing is, we've seen this hint before... to no avail.
There is a new nuance this time around though. Traders are migrating into safer sectors, and out of more cyclical, riskier ones.
This showed up in a big way with Tuesday's action, with healthcare stocks being the only group to log gains. At the bottom of the pile you'll find cyclical stocks, off 2.4% for the day. This action mirrors similar leadership and laggardship for the past week, which shows a slow migration out of riskier groups and into more defensive ones.
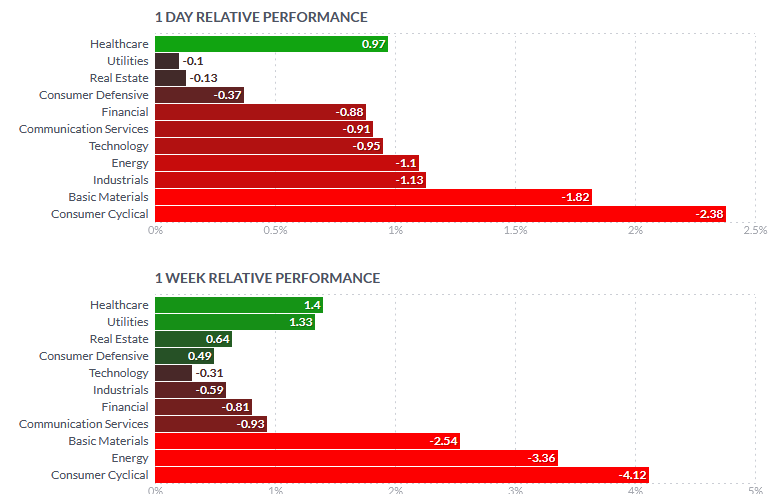
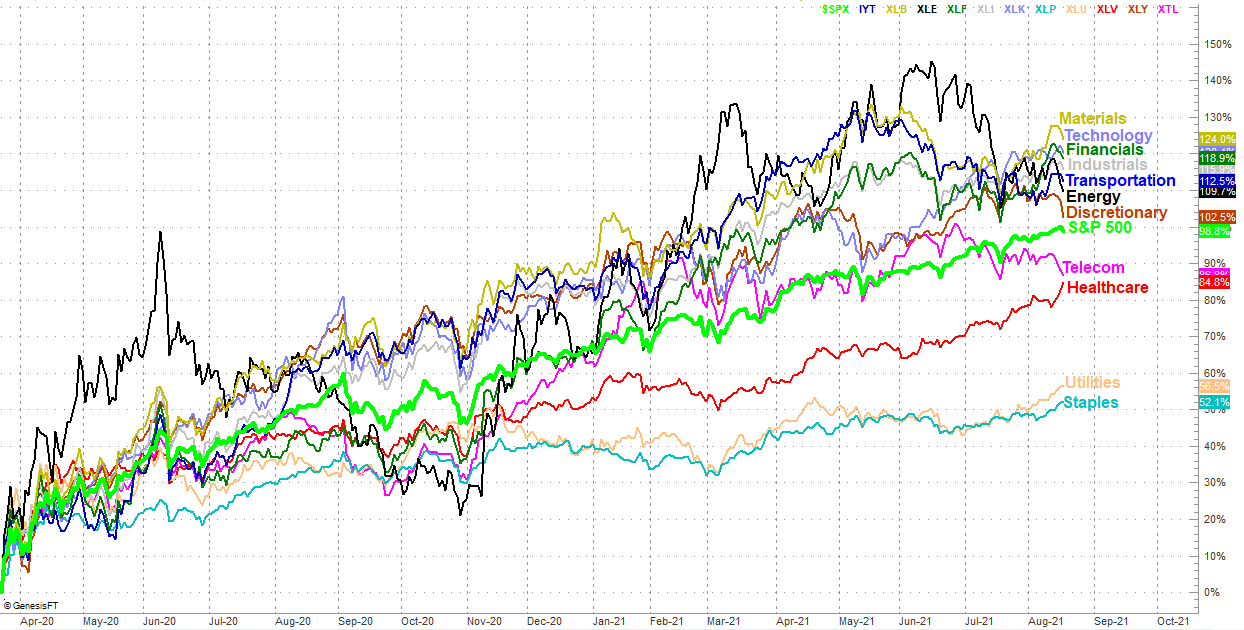
Here's the same story told from a different perspective. The healthcare, utilities, and staples that have been lagging for months are now all of a sudden back in favor, while cyclical - and aggressive - sectors like discretionary names, energy, and transportation names are tumbling. Were the hyper-popular FANG stocks and other NASDAQ-listed tech names not part of the technology sector, the tech sector itself would also be peeling back quite a bit more than it is.
This matters simply because it's such a big paradigm shift from the way things were just a few weeks ago. Something's clearly changing, which is telling in and of itself. When traders start to perceive things differently, they often end up causing the very thing they fear could happen.
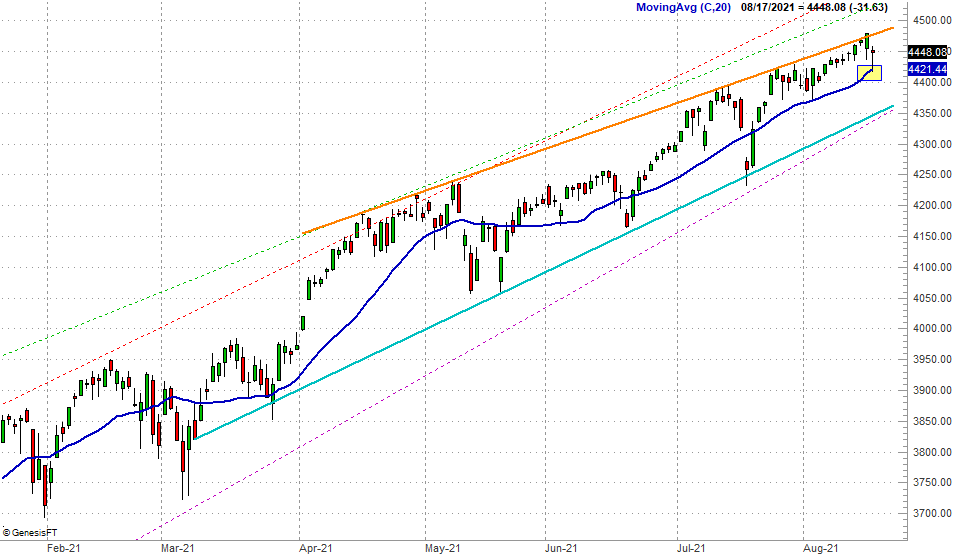
It should be noted that even with Tuesday's pullback, the market's still plenty strong. The selling not only didn't drag the S&P 500 below its 20-day moving average line (blue), that moving average line actually served as a pushoff point to spark a partial intraday recovery. This quick rebound suggests there are at least some bulls ready to buy on even the most modest of dips.
The NASDAQ Composite is also still holding above its 50-day moving average line (purple) at 14,524.
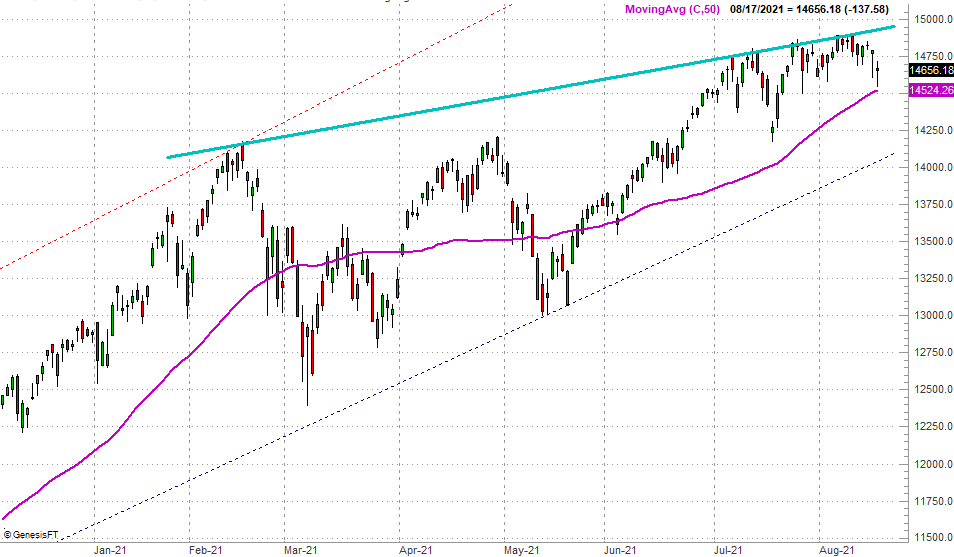
Both the NASDAQ and the S&P 500 are also still within narrowing trading ranges marked by dashed and solid lines on both charts above. Both indices could actually slide all the way back to the lowest of these boundaries and still technically remain in an uptrend.
Again though, for the first time in a year and a half we're starting to see serious sector rotation. At the very least we should respect the possibility that this signals a deeper, more fundamental change in the trading psyche. One can't help but wonder if traders are unconsciously assuming the coming month of September will be the usual slow one... particularly in light of the fact that the market is so far "ahead of schedule" for the year so far.
Of course, the bears are going to have to make a sustained commitment here if they're going to turn Tuesday's blow into something more.
Stay tuned. Things are getting interesting.