This is What Usually Happens Following a Crash (and Rally) of the NASDAQ Composite

For a brief period since mid-March it seemed like stocks were going to bounce back from their prior pullback. All told, the NASDAQ Composite tumbled 22% from its November peak to its March low. That's a correction - technically a bear market - but the composite also rallied nearly 17% from that low its high hit on March 29th. That jolted the market out of a downtrend, and set the stage for a more prolonged advance.
Over the course of the past week though, stocks have started slipping again. The Nasdaq now sits more than 5% below its late-March high, and its back to 15% below its November peak. Notably, the composite is also back within sight and reach of lows hit in mid-March. Maybe the correction hasn't completely run its course just yet.
The thing is, perhaps most people are making too much of the size and span of the correction. In some ways they may even be looking specifically for clues that suggest more downside is in store. That's dangerous. When you're looking for something specific meant to prove your foregone conclusion, you're probably going to see it sooner or later.
With that in mind, we actually crunched the numbers of what happens during and after the typical correction/bear market for the NASDAQ Composite. The results were... actually not all that surprising.
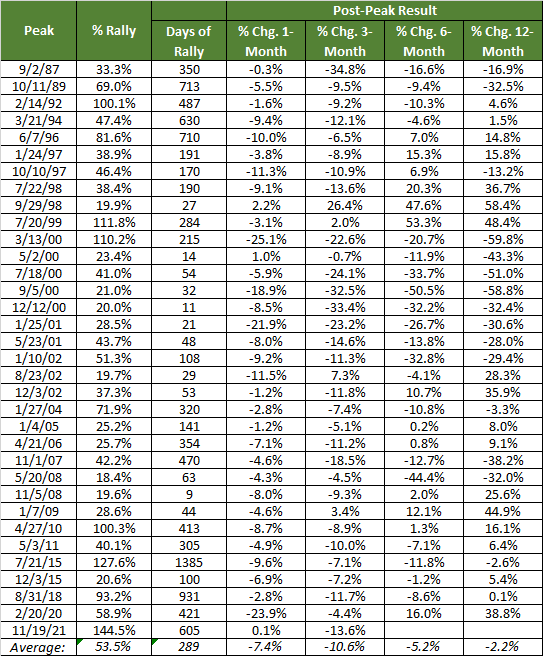
Perhaps most noteworthy is the fact that the market always bounces back, and usually sooner than you might expect. On average, the composite is nearly 8% above its correction low within a month of that low being made. Three months later it's up on the order of 14%. Within six months the Nasdaq has recovered by nearly 20%, and within twelve months its up almost 27%.

There's a catch, of course. The catch is, you don't know when the bottom has actually been made. You can make reasonable guesses as to when it might have been made, again using averages. The average length of time it takes the NASDAQ Composite to slide more than 20% from a major peak to a major bottom is just under 90 calendar days.
Don't blindly take this to heart. Sometimes the rout can be much bigger and much more prolonged than the averages would imply. And, the market's not always higher just a few months following a major meltdown. This was certainly the case during the bear markets of 2000 and 2001, and in 2008. Jumping into the market after a NASDAQ correction of 20% or more would have proven a very costly mistake. If we're actually moving into a bear market now, odds are good the composite won't fully rebound before starting yet another 20%(+) tumble.
If this is just a little bearish turbulence though, the odds favor wading back in despite the steep selling seen over the course of just the past few days.
Of course, keep in mind the stock market is supposed to move higher, making these post-pullback rebounds a little less surprising than they might get credit for.
Or, perhaps not.
There's a flipside to the flipside. That is, just as stocks tend to bounce back from big pullbacks, they tend to weaken following prolonged runups. The same problem remains: We can't know exactly when the market is topping out any better than we can know when the market's bottoming. We do know, however, that the NASDAQ doesn't maintain or restore bullishness very well once a major high has been made. It's no surprise that the composite is usually about 7% lower following a major high. Curiously though, the NASDAQ Composite is also down slightly from a peak price 3 months, 6 months, and 12 months after that peak has been made.
While the market may be meant to always move higher, it can absolutely burn up too much bullish fuel too fast, leaving its tank on empty for months at a time. In other words, it's not crazy to shed stocks or "lighten up" when it really looks the market's at a major high. That was certainly the case in November.
Whatever the case, be wary of leaning too much on any historical data. No two situations are exactly the same. Learning to read charts and applying a little common sense can go a long way in navigating the market, and trading it. The key is always ultimately about spotting highs and lows that mark major turning points no matter how long those moves have lasted and how far they've traveled. That's still just plain hard to do.