This Is How Bad Wednesday's Tumble Was... Or Wasn't
On the surface it's troubling. A rarely-seen downgrade of the United States' government-issued debt didn't just spark some selling. It prompted the worst selloff in several weeks, with the NASDAQ logging its biggest daily loss since February, in fact. Already overdue for some profit-taking, the day's stumble looks like it might just get that ball rolling.
Don't be too quick to jump to that conclusion, however. While sizeable, Wednesday's selling wasn't exactly devastating.
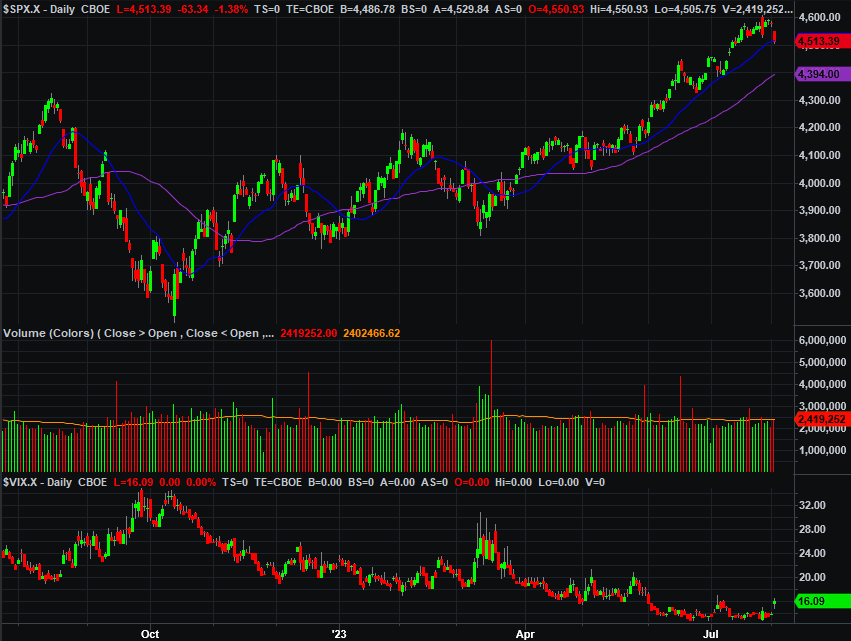
The daily chart of the S&P 500 helps us keep things in perspective. The index barely broke under its 20-day moving average line (blue) at 4520... for the first time since May. In June and July it found support there. But despite the big selloff, the volume behind the selling didn't exactly soar. It was just average. This may not reflect the market's majority opinion.
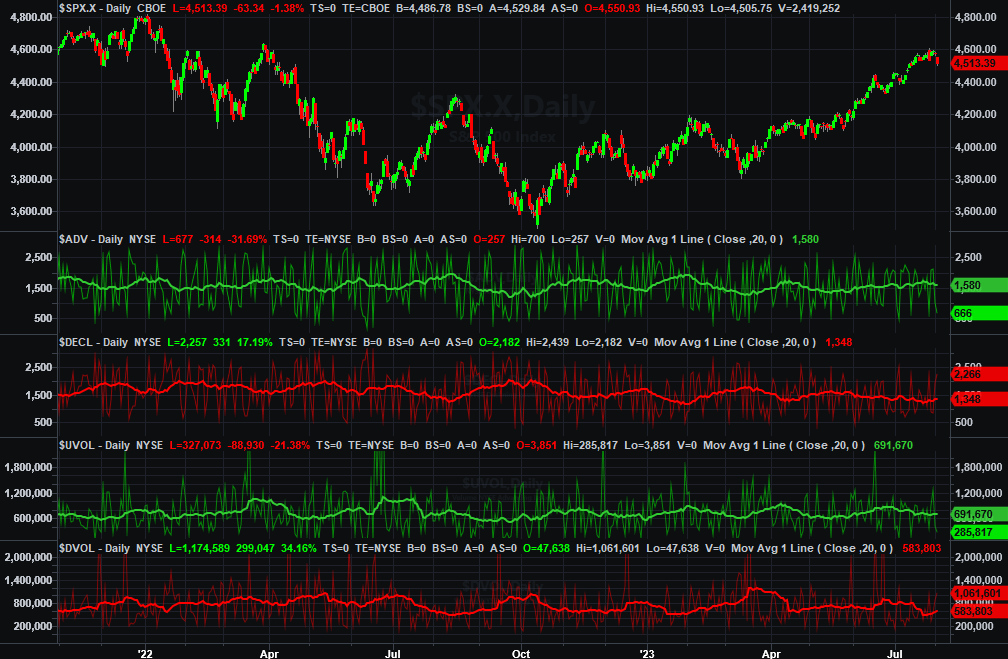
And taking a deeper dive into the market's breadth and depth doesn't put this view into question. The NYSE's total decliners of 2266 is high, but not huge. The 1.06 billion NYSE-listed shares that lost ground on Wednesday is above the recent average, but hardly uncomfortably high. Advancers and "up" volume were also both clearly down, but not overwhelmingly so.
Notice how the Volatility Index (VIX) didn't jump a great deal either, as one might have expected it to if this were a true pivot into a downtrend.
This isn't to suggest the market still can't continue moving lower. It may well do it. Based on what we see thus far though, that's not a foregone conclusion. In fact, given the bearish opening gap left behind on Wednesday and the sheer size of Wedneday's loss, the bulls actually have an edge heading into Thursday's action.
And even if the market doesn't bounce back on Thursday there's still a good amount of room for stocks to keep falling without actually breaking the uptrend. The 50-day moving average line (purple) at 4394 is the next key line in the sand. The S&P 500 could slide all the way back to that mark before developing too much downward momentum to stop. The VIX would also "play along" by making a clear thrust out of its long-term downtrend.