Technical Analysis Using Moving Average Lines: Simple But Powerful
When it comes to technical analysis of stocks, moving averages are one of the most commonly used indicators. A moving average line is simply an average of the stock's price over a specific period of time. In this article, we'll take a closer look at how to use moving average lines in technical analysis of stocks.
Understanding Moving Averages
A moving average is a calculation of the average price of a stock over a specific period of time. For example, a 50-day moving average is the average price of a stock over the last 50 trading days. Moving averages are used to smooth out fluctuations in stock prices and help traders identify trends.
There are two main types of moving averages: Simple Moving Average (SMA) and Exponential Moving Average (EMA). SMA is calculated by adding up the closing prices of the stock over a specific period of time and dividing by the number of periods. EMA is a more complex calculation that gives more weight to recent prices.
Using Moving Averages in Technical Analysis
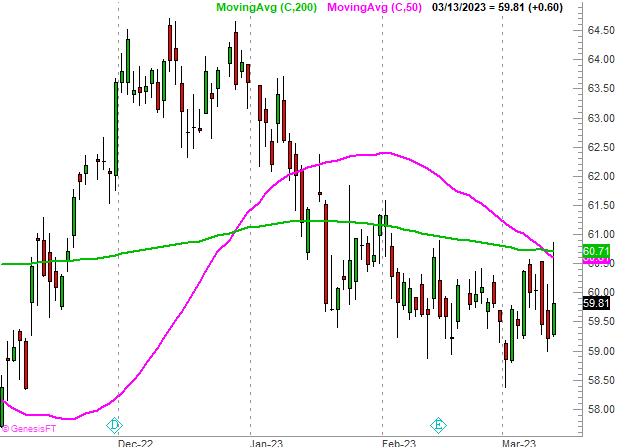
[caption id="attachment_63185" align="alignright" width="300"] Coco-Cola (KO) shares are not only struggling to move above their 200-day moving average line (green), but the 50-day line's (pink) move under the 200-day moving average is an outright sell signal.[/caption]Moving averages can be used in a variety of ways in technical analysis. Here are a few examples:
1. Identifying Trends: One of the simplest ways to use moving averages is to identify trends. If the stock's price is consistently above its moving average, it's considered to be in an uptrend. Conversely, if the stock's price is consistently below its moving average, it's considered to be in a downtrend. Traders can use moving averages of different lengths to identify short-term and long-term trends.
2. Support and Resistance: Moving averages can also act as support and resistance levels. If the stock's price falls below its moving average, the moving average can act as a support level, preventing the stock from falling further. Conversely, if the stock's price rises above its moving average, the moving average can act as a resistance level, preventing the stock from rising further.
3. Crossovers: Moving averages can also be used to identify potential buy and sell signals. When a shorter-term moving average crosses above a longer-term moving average, it's considered a bullish signal. Conversely, when a shorter-term moving average crosses below a longer-term moving average, it's considered a bearish signal.
Limitations of Moving Averages
While moving averages are a popular tool in technical analysis, they do have some limitations. For example, moving averages can lag behind the stock's price action, which means traders may miss out on some of the early signals. Additionally, moving averages can be affected by sudden price spikes or drops, which can skew the average.
Conclusion
Moving averages are a useful tool in technical analysis of stocks. They can help traders identify trends, support and resistance levels, and potential buy and sell signals. However, it's important to remember that moving averages are not a foolproof indicator, and should be used in conjunction with other tools and analysis techniques.