Sector Drill-Down: 2 Groups Are Showing Resilience
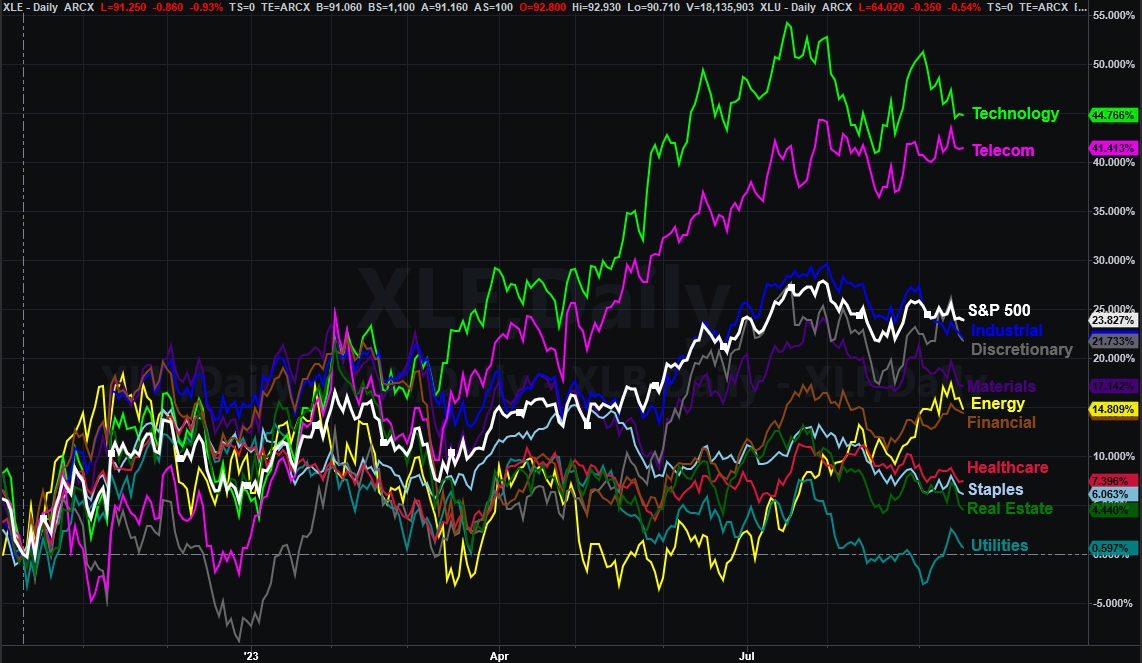
The past year has been a mostly-good one for the broad market. But, it’s also been a very imbalanced one. Technology stocks have done most of the heavy lifting, while telecom stocks – though there aren’t many of them – have trailed closely behind. Everything else? Not so great. In fact, everything else has lagged the S&P 500 since last October’s bear market bottom. Take a look.
As the old saying goes though, what’s done is done. The only thing that matters now is what lies ahead.
And what might that be? The performance comparison chart above isn’t a complicated one to interpret. What you’re looking for is a clear direction. You have to make allowances for day-to-day volatility, so none of these sector-based indexes will ever move in a straight line. But, if you take a step back and look at the bigger picture, you will see some groups starting to lead while others are starting to lag.
With that as the backdrop, not take a longer, closer look at the sector comparison chart above again. There are two groups making measurable bullish progress. That’s financial stocks, and energy stocks. Both had been subpar performers until June/July. Then both started lapping other, falling sectors.
That’s not the only noteworthy detail evident on the chart, however. Also notice that most sectors are now in the red since late-July. The S&P 500 itself isn’t, buoyed by the still-resilient telecom and technology indexes. With the exception of discretionary stocks though, all other sectors are now at multi-week lows. And, tech and telecom stocks are knocking on that door.
As for what to do with this information, that’s up to you. Maybe nothing. If you’re looking for any trading edge you can get though, take this data at its simplest face value. That is, recognize that financial stocks and energy stocks are doing better than others. If you get a clear buy signal for one of these names, it arguably means more. Conversely, if you get a sell signal for… say and industrial name, know that these stocks are being readily ushered lower anyway. Ditto for real estate, consumers staples, and basic materials.
Of course, also bear in mind that any or all of these trends could reverse at any time without any warning. There are no guarantees in trading. Just information that helps you better assess the odds.
At the other end of the spectrum, however, is rewards that make risk worth taking. The reward here is the significant edge of picking the right sector or avoiding the wrong one. As the comparison chart shows us, the difference between the market’s best-performing sector and worst-performing one since late October is a hefty 44%. Even if you only captured half of the technology sector’s alpha, you’re still beating the S&P 500 by about 10%. That’s the index’s average annual gain, essentially meaning you’re squeezing an extra year’s worth of gains into your bottom line with no additional time needed.
That’s why you pay attention to this kind of stuff.