Presidential Term Analysis: Look For a Brief Blip, Then a Bit of Bullishness, Then....

Are you a believer in the idea that the stock market follows seasonal cycles? You should be. While the calendar hardly dictates the market's every move, there are time-based tendencies that often play out... over and over again. If nothing else, seasonal trends can help you better understand the odds of what looks like's coming down the pike. Even four-year U.S. presidential terms have their clear tendencies that show you what's more likely (or less likely) to happen when the future isn't clear.
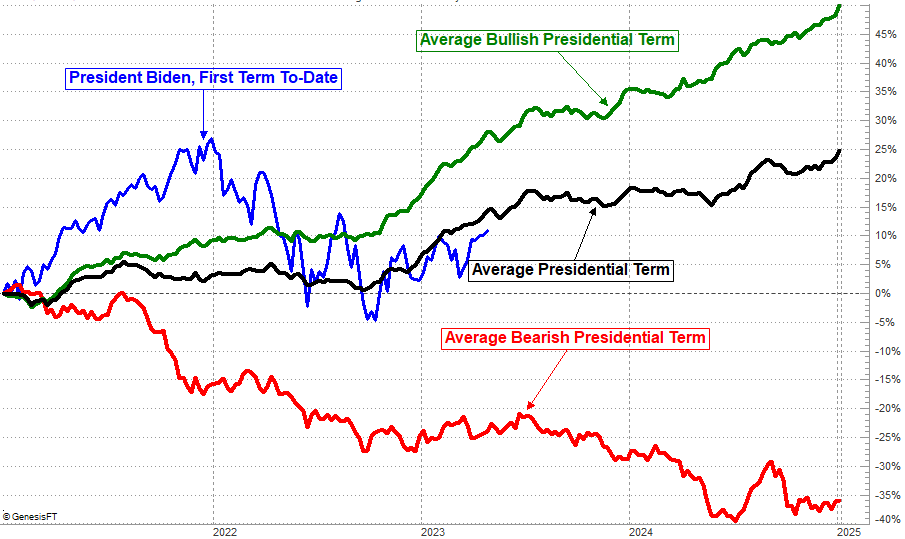
And that's good news as well as bad news right now, although not a lot of either. In other words, if history repeats itself, the market is apt to push just a little higher through the middle of this week before peeling back just a bit more. Then, beginning around the 19th, stocks should log another respectable (albeit modest) advance through mid-July before drifting lower through late November. Then, the usual year-end bullishness kicks in again. As the chart below shows is, this is the surprisingly typical action for the third year of most presidencies.
Note that this year's actual performance of the S&P 500 is nearly aligned with the index's normal path through this point in time.
Don't misread the message. When we're in a bear market, the third year of any presidential term is generally a loser. Likewise, when we're in a bull market, the third year is a healthy winner. The average performance is also bullish because we're in a bull market far more often than not. The bigger-picture tendency is still the same though. That is, third-year bullishness is usually seen during the first half of the year. The second half is lethargic, and broadly bearish when in a bear market.
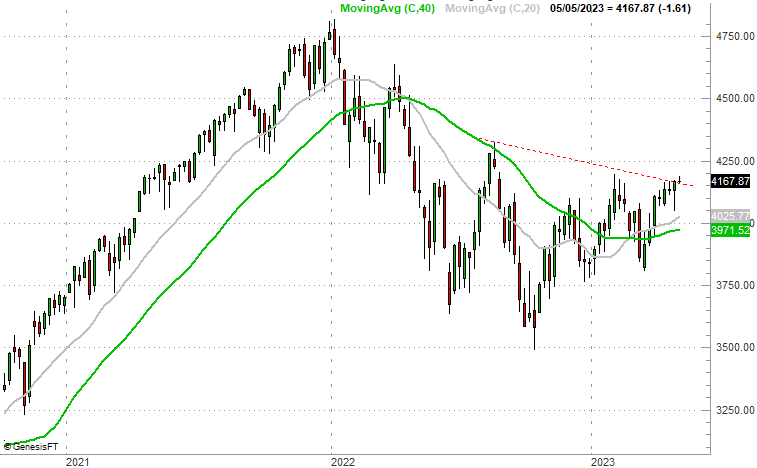
What's curious -- and encouraging -- is that the S&P 500 is already in a technically bullish mode that supports this near-term bullish prediction. It just logged its highest high in weeks, and is priced above all of its key moving average lines. It's even chipping away at straight-line resistance (red, dashed). Perhaps most important, there's room for the market to peel back just a little bit without snapping the uptrend. That means there's room for the usual dip we see in the first half of May in the third year of a president's term.
Nothing is ever etched in stone, of course. It's entirely possible the market could crash, and then continue crashing. It's also possible stocks could soar higher and not look back until well into next year. Never say never.
This is a cycle, however, with a great deal of reliability. Each year of a four-year term has its own likelihoods that apply when the market is bullish or bearish. Ignore these tendencies at your own peril. Just don't make them the only analysis you're doing.


