Opinion: This powerful stock-market rally isn't ready to call it quits
The S&P 500's technical indicators remain bullish
By Lawrence G. McMillan, MarketWatch
Stocks continue to advance at a rapid rate. The S&P 500 has closed at all-time highs on 11 of the year's 14 trading days through Monday. The closest thing to a correction was a half-day of correction (down 40 points from high to low on Jan. 16).
There is now minor support at 2770 - the low of that half-day correction. The advance has been so rapid, though, that there are not many other support areas until the 2680-2700 area, where there should be important support. A violation of 2680 would cause a reassessment of the bullish intermediate-term trend.
There has been little or no sign of negative divergences. Yes, there are overbought conditions, but they have not yet generated confirmed sell signals in most cases.
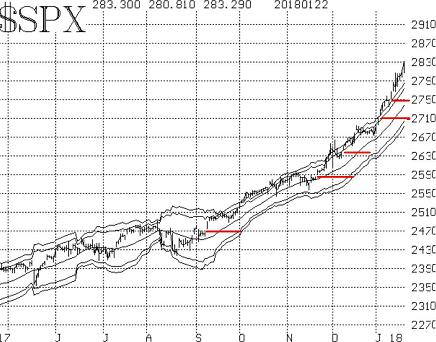
The S&P continues to generate gaps on its chart. The half-day correction filled one gap (barely), but there are still five left. They are marked with red horizontal lines on the S&P chart.
This may not seem significant until one realizes how hard it is to get a major index like the S&P 500 to gap. Most of the index's components have to gap as well, and that is usually a very difficult feat.
In any case, this is a sign of strength. Some may say that those gaps have to be filled. Perhaps, although I don't see any reason why. But even if they are to be filled, you certainly couldn't have been shorting the market all the way up, hoping for some vague correction, because you'd have been wiped out by now.
The S&P remains above the +4ó "modified Bollinger Band" (mBB), as it has done for over two weeks. The last time we saw anything even approximating this was in February 2017. Then, the S&P was above the +4ó Band for 15 straight trading days, and on the 14th day it gapped upward and closed right on its highs. That led to a modest correction, including a so-so mBB sell signal, as the market declined modestly for paper help about six weeks. The S&P didn't make significant new highs until almost three months later.
The point is that when this current rally ends, and we will be able to identify that through the mBB sell signal, expect the market to pause for several weeks, if not months. But I don't think a major top will form because of that.
SPX is accelerating away from the "modified Bollinger Bands," which are lagging behind. The main reason they are lagging behind is that realized volatility remains low. You might think it's increasing because the stock market is increasing more rapidly, but the standard deviation of the advance is not increasing. Hence the Bands are still relatively tight around the 20-day moving average. The 20-day historical volatility of SPX is still only about 7% (the 100-day realized volatility is only 6%).
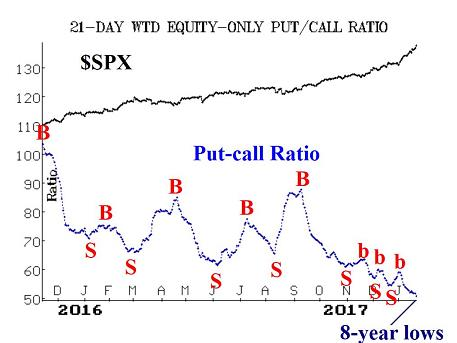
Equity-only put-call ratios continue to make new multi-year lows. The standard ratio hasn't been this low since the summer of 2014, and the weighted ratio hasn't been this low since the spring of 2010. Both recently have had failed sell signals (three for the weighted and one for the standard). That's a bit unusual, but then this is an unusual market. All we can say for sure is that there has been massive call buying - especially since these ratios began to plunge deeply into multi-year lows since last November.
From a contrarian point of view, that augurs for a market correction. However, we need to see these ratios begin to rise and trend higher in order to generate the next sell signals, and that just isn't happening yet. For now, they are overbought, but not yet on sell signals.
Market breadth continues to be one of the weaker indicators. Recently, the NYSE breadth oscillator generated a sell signal, since been canceled out, but the "stocks only" breadth oscillator has not.
The cumulative advance-decline lines have continued to make new all-time highs, pretty much along with SPX itself (10 times to far this year). That is confirmation of the index's move and is one major thing that keeps the intermediate-term outlook bullish.
New highs continue to dominate new lows, although the ratio is diminishing. If new lows were to begin to outpace new highs while the market continued to rise, that would be a negative divergence. We have seen no signs of such a divergence at all.
Volatility has perked up a bit. VIX is in a tiny uptrend, but even so, it has not reached 13 yet. That's the level where we have rather arbitrarily set our demarcation line between bullish and bearish. As long as VIX closes below 13, that's bullish for stocks. If it begins to close above 13, that would be more bearish for stocks.
During that half-day selloff, VIX probed toward 13, but did not reach it. On a couple of days, VIX has been higher while the S&P was higher as well. That's not normal, and some were taking it as a bearish sign. Subsequent rises by the S&P to new all-time highs have pretty much shown that it was not a bearish sign - at least not so far. One wag on TV suggested that VIX was rising because the stock market was rising at a faster rate than it had been previously.
As pointed out earlier, this argument fails to hold water because the S&P's realized volatility is not increasing, despite the apparent acceleration to the upside. The way the realized volatility calculations work means it is difficult to rise much in a bullish market. Usually it takes a "whippy" or declining market to increase realized volatility. The bottom line is that VIX is still not a problem for the rising stock market.
In summary, the S&P chart remains bullish and so does our intermediate-term outlook. Until or unless the index begins to break some support levels, this outlook will not change. But there are overbought conditions, as highlighted by the mBB pending sell signal, extremely low put-call ratios, and a possibly uptrending VIX. Those could rather easily come together to issue sell signals at more or less the same time, and they should be acted on if they do. But their best result would only be a short-lived, but perhaps sharp, correction unless the SPX chart also weakens.
From MarketWatch