New highs are in store for the S&P 500 this year according to this chart, says top strategist
Trick or treat?
With stocks already down more than 2% for October, investors might be wondering which side of the spooky settlement they'll get as they position their portfolios for the end of the year.
But the post-Halloween period is likely to bring more treats than tricks for equities, said Stephen Suttmeier, chief equity technical strategist at Bank of America Merrill Lynch.
"I actually think we're building some kind of a base," he said Tuesday on CNBC's "Trading Nation," citing a chart of the S&P 500 index. The S&P closed at 2,893.06 on Tuesday after falling more than 1.5%.
"Generally speaking, market breadth indicators have been fairly constructive, and we're still in this weaker seasonal period. So ... the weaker seasonality has given us the trick," he said. "But seasonality gets a lot better in November on a three-month and six-month basis going back to 1928. I think that's where the treat comes in."
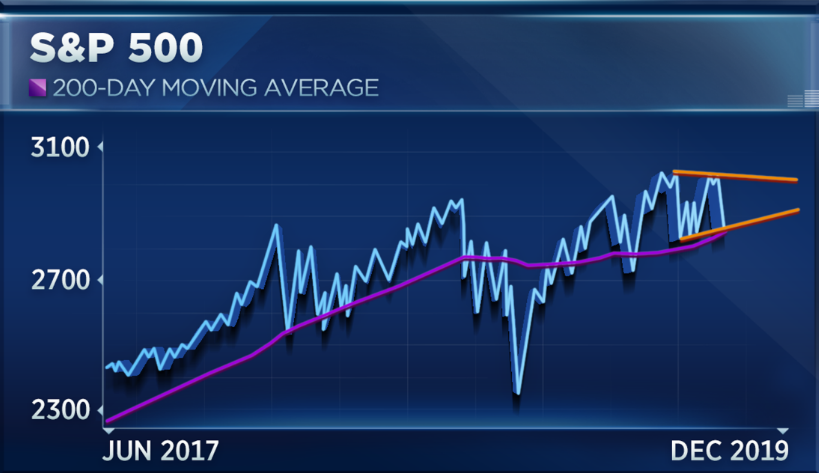
For now, the chart supports Suttmeier's thesis. He flagged a triangle pattern forming above the index's 200-day moving average, a narrowing trading range that technicians typically find to be a good indicator of an upcoming breakout.
"So, you buy the lower end of the range, meaning you buy 2,850, and, for now, you sell the upper end of it around 3,000," he said. "But I do think eventually this should resolve higher given that the breadth has been positive [and] investor sentiment generally pretty bearish out there."
In short, barring a significant increase in negative macroeconomic data, the S&P's trading pattern should strengthen, not weaken, into 2020, said Suttmeier, who has a 3,100 year-end target for the index. Bank of America Merrill Lynch's fundamental team has a 2,900 year-end target.
"We think this resolves to the upside, meaning going to new highs, and if that happens, we think we could hit that 3,100 area," Suttmeier said. "That triangle pattern itself would suggest there's actually upside towards that 3,200 area if that bullish seasonality kicks in on the S&P."
There's just one catch.
"If we're going to focus on one thing ... that could change the view, I think we've got to pay attention to the option-adjusted spread for U.S. high yield," Suttmeier said.
That refers to the ratio between high-yield investments versus U.S. Treasurys. Chart watchers use it to track when credit risk is rising and falling, and the moments when it rises dramatically typically correlate with big drops in stocks.
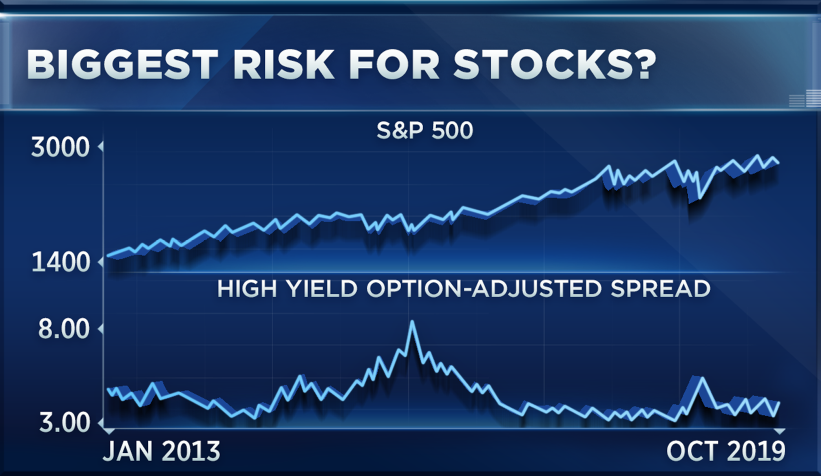
The 4.40 to 4.44 level is the key one to watch right now, according to Suttmeier. The spread was just above 4.00 on Tuesday.
"As long as we're below those highs, I think we're benign for high yield and the S&P should resolve higher. But we're going to watch this as a risk factor," he said. "If this starts to clear through here, it will suggest the spread between high yield and Treasurys is rising, increasing credit risk, and that generally does not treat equities well."
But the current setup mirrors times in the recent past when the market was able to push past its bearish concerns and climb higher, Suttmeier said.
"Right here, right now, we think [2019 is] really more similar ... to 2016, 2012," when stocks sank in October only to reverse and end the year higher, he said.
Back then, Wall Street was also facing "bearish investors, bond yields on the 10-year note below 1.5[%], ISM below 50, and that all eventually turned around," Suttmeier said. "But just pay attention to this. I think it's a key risk factor to focus on as we struggle with October and move into the more bullish seasonal period starting in November."