
With nothing more than a passing glance it would be easy to look past Monday's market action and simply plan on checking back in on Tuesday. The NASDAQ Composite essentially broke even, and though the S&P 500 and the Dow logged measurable losses, neither made major breakdowns in terms of closing prices.
If you take a few extra moments to look at each index's daily chart though, you'll see there's actually more to the story. We may be moving into Tuesday's session in a firmly bullish mode. Or, we may be one more rough day from moving into a more serious meltdown. Either way, Monday's action presses a long-standing issue, and presses us towards long overdue clarity.
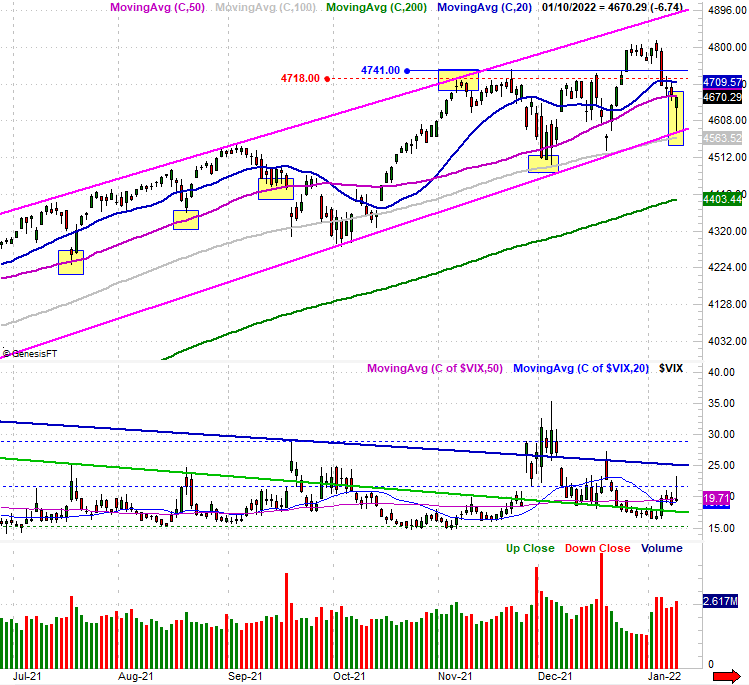
The key is the height and shape of Monday's bars. Take the S&P 500 for instance. The day's close of 4670.3 was down 6.7 points from Friday's last trade, but that close is also well above the low of 4582.2. That's a huge intraday reversal, and more than that, the reversal started to materialize right when a well-established technical floor (pink) was brushed.

This is exactly where you'd expect to see the bulls make a stand, using a floor as a big pushoff point.
The NASDAQ Composite logged a similar -- though not identical -- bar. The index hit a low of 14,530 before bouncing back to a close of 14,942. That's a gain of only 7 points for the day, but a close that's 412 points above the low... a low that was made just shortly after the NASDAQ traded below its 200-day moving average line (green) at 14,678.
Again, this is where you'd expect the bulls to start plowing back in. They did. The closes at or near the high for the day implies the bulls couldn't get enough, right up until the point the closing bell rang. They may stand ready to keep buying when trading resumes on Tuesday following Monday's long-tailed reversals.
Still, there's a respectable chance Monday's intraday recovery effort is just a headfake before moving on to lower lows. The NASDAQ closed below a long-standing technical floor that connects all the key lows going back for several months. And, a break under the 200-day line is more likely to be a process than an event.
The key here is (still) the volatility indices. The NASDAQ Volatility Index (VXN) briefly moved above resistance around 28.7, while the S&P 500 Volatility Index (VIX) moved above its ceiling around 21.7. Both ended up falling back under those levels instead of easing into a more bearish mode. But, the bears are still starting to show -- and play -- their cards. They may not be holding a winning hand, but we don't know that for sure.
Whatever's in the... well, in the cards, it's going to become obvious soon. It's only worth mentioning because we're finally so close to a true corrective move. Underscoring the potentially-bearish argument is the fact that for the past couple of decades, January as well as the first quarter have actually been more likely to be bearish than bullish.
We'll see.