Weekly Market Outlook - Um, Yeah... That's Gonna Be a Problem
A week ago it looked like stocks had a fighting chance at rekindling the then-struggling bull market. Last week's rout changes everything. Not only did the weakness up-end the bullish effort before any of the indexes could log a higher high, the selloff led to a lower low that also dragged the market below critical technical support levels.
Anything's still possible. It's possible the market could still renew its budding uptrend before slipping into any more, more-problematic trouble. The odds of that being the case just dropped dramatically though.
We'll look at the whole thing in some detail below. First, however, let's look at last week's major economic news and preview what's in the pipeline for this week.
Economic Data Analysis
There was only one noteworthy release of economic news last week, but it was a biggie -- jobs. The Bureau of Labor Statistics posted February's payroll and unemployment numbers on Friday. It was good. Although the unemployment rate actually ticked higher from 3.4% to 3.6%, that's mostly due to the fact that a whole lot of people re-entered the jobs market (but aren't working just yet, or aren't working again). While payroll growth slowed from January's pace of 504,000 to 311,000 this time around, that's far better than January's figure of 205,000. Also bear in mind that unemployment/joblessness is already at absolute structural lows, to major progress on this front will be tough to come by.
Unemployment Rate, Payroll Growth Charts
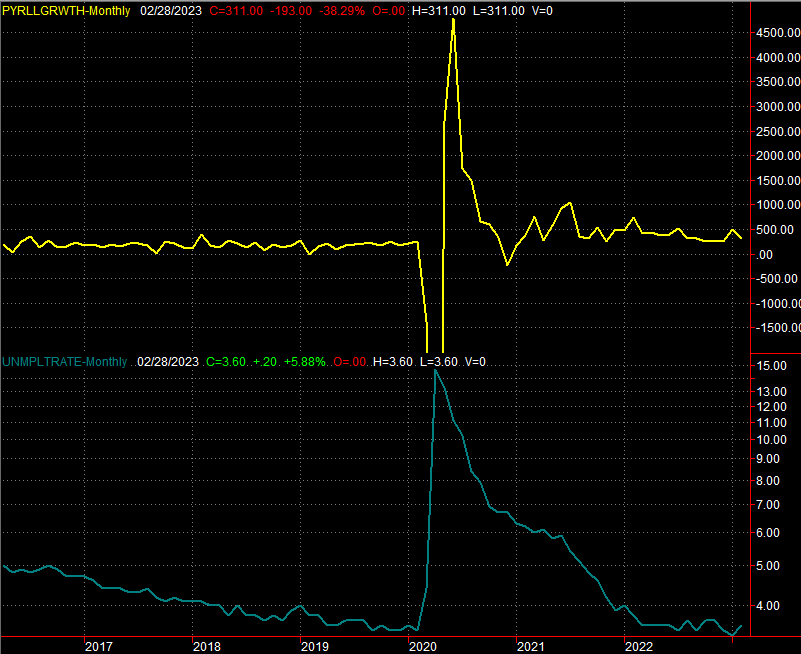
Source: Bureau of Labor Statistics, TradeStation
Everything else is on the grid.
Economic Calendar
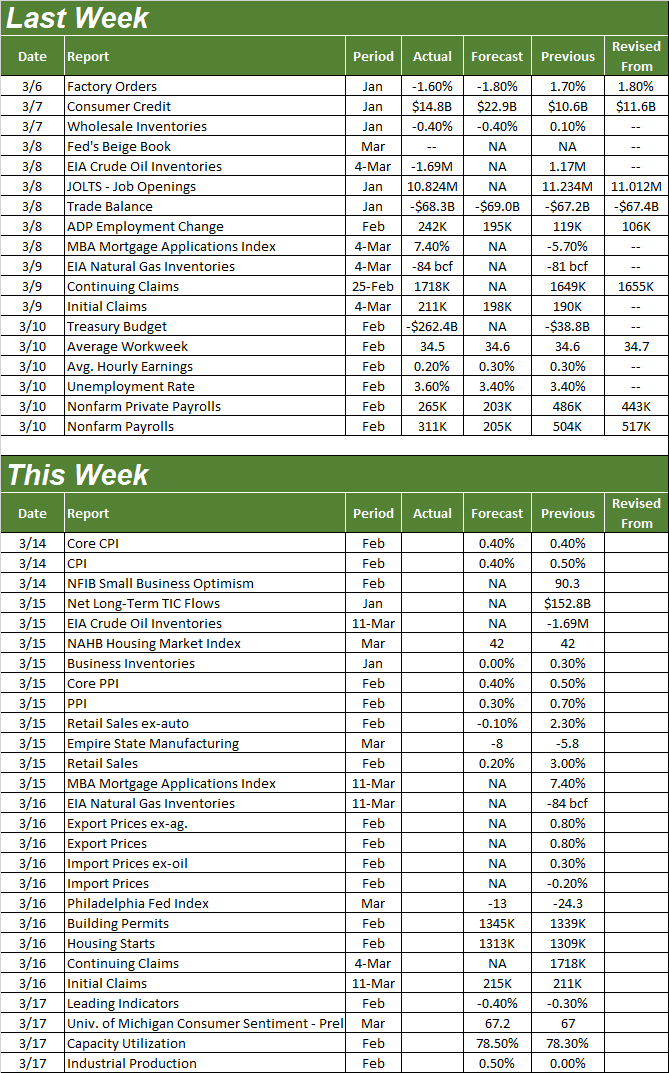
Source: Briefing.com
This week is loaded.
Inflation is in the lineup. Consumer inflation numbers will be posted on Tuesday, with producer inflation data due on Wednesday. Forecasters are calling for the same fairly-brisk inflation rate for consumers, although the nation's factories and production plants should once again find a little bit of relief. Even so, price increases are still firm even if not as painful as they were a year ago.
Inflation Rate Charts

Source: Bureau of Labor Statistics, TradeStation
The inflation figures of course will play a role in the Federal Reserve's stance on future rate hikes.
February's retail sales data will be coming out on Wednesday as well. You may recall retail consumption surged in January. We're not likely to see another wave of growth like that this time around. However, consumerism is projected to show solid growth for last month, suggesting inflation isn't stifling spending, and that consumers are still feeling confident enough to shell out some discretionary dollars.
Retail Sales Charts
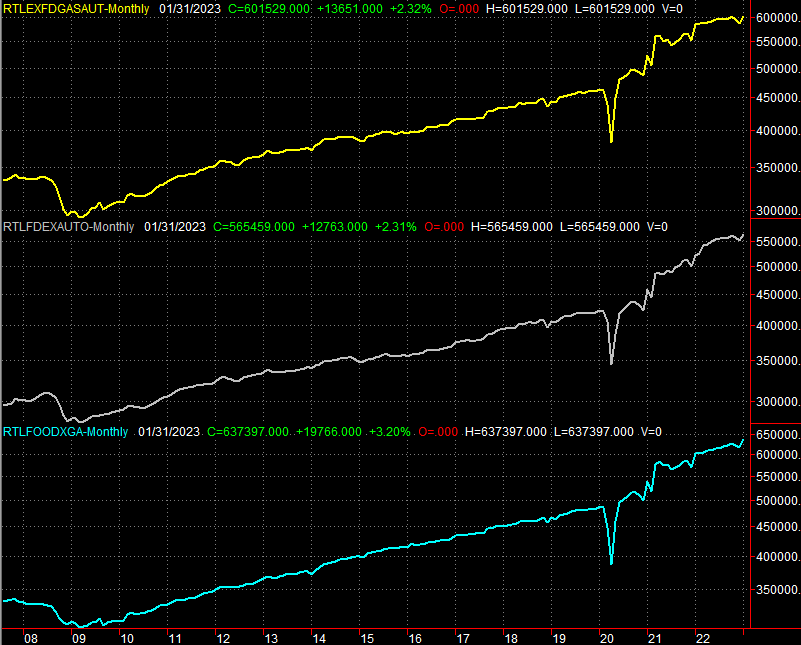
Source: Census Bureau, TradeStation
On Thursday we'll get February's housing starts and building permits data. These numbers have been subpar for a while now, and that's not likely to be any different this time. Real estate remains a relative soft spot for the overall economy.
Housing Starts and Building Permits Charts
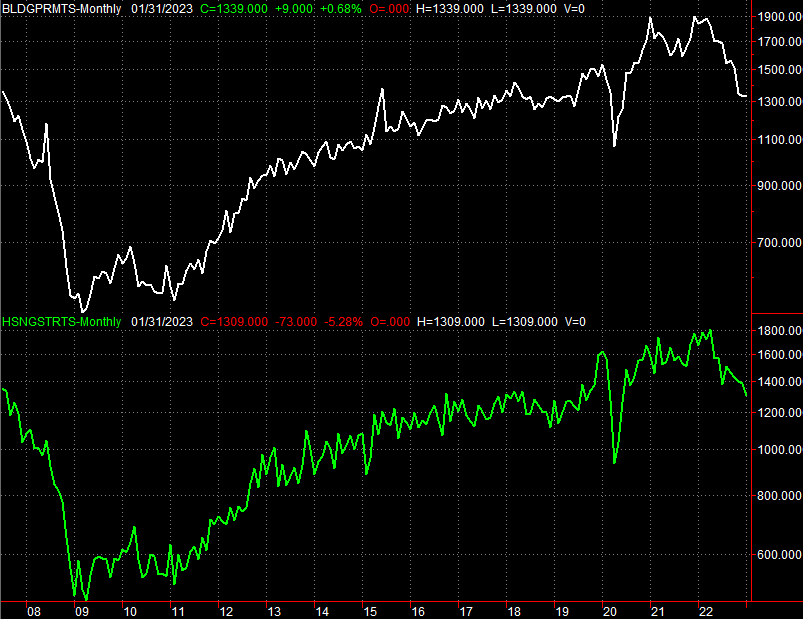
Source: Census Bureau, TradeStation
Last but not least, the Fed's capacity utilization and industrial productivity report for February will be released on Friday. Look for a little progress on both fronts, but don't look for a firm reversal of either data sets' current downtrends.
Industrial Productivity and Capacity Utilization Charts
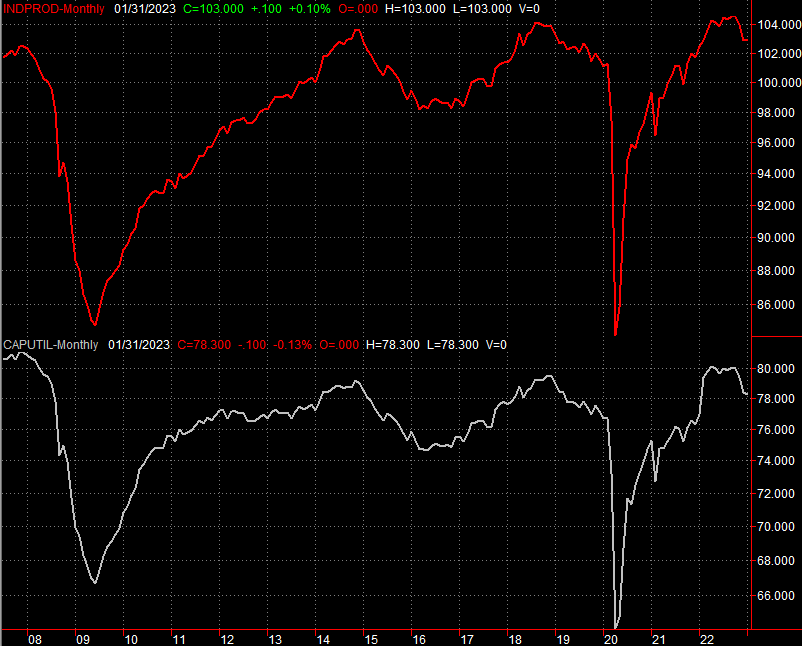
Source: Federal Reserve, TradeStation
Stock Market Index Analysis
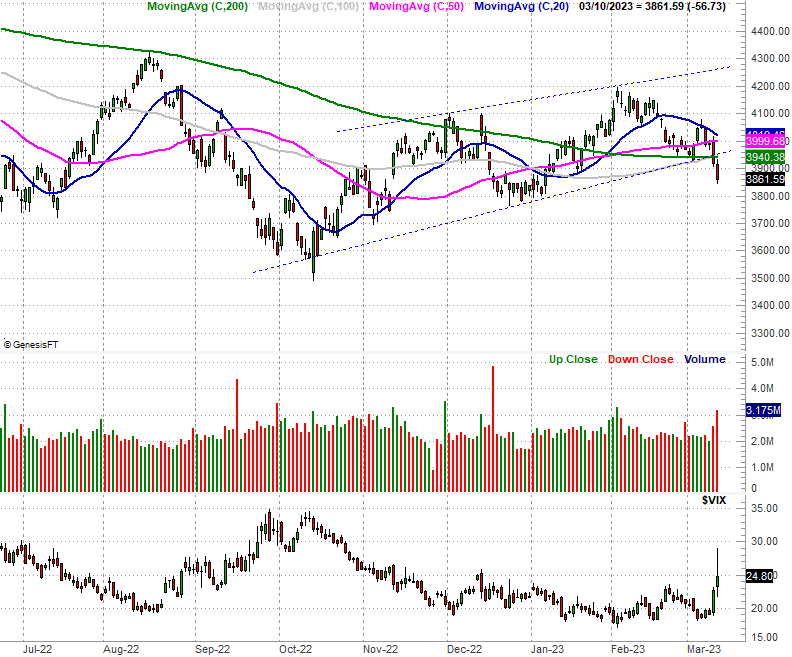
We'll jump right into this week's analysis with a look at the daily chart of the S&P 500. As is crystal clear, the index broke below all of its key moving averages as well as below a rising support line to make it lowest close in over a month on Friday. Perhaps worse, there's plenty of volume behind the move... the last two days of last week's rout does indicate the current majority opinion.
S&P 500 Daily Chart, with VIX and Volume
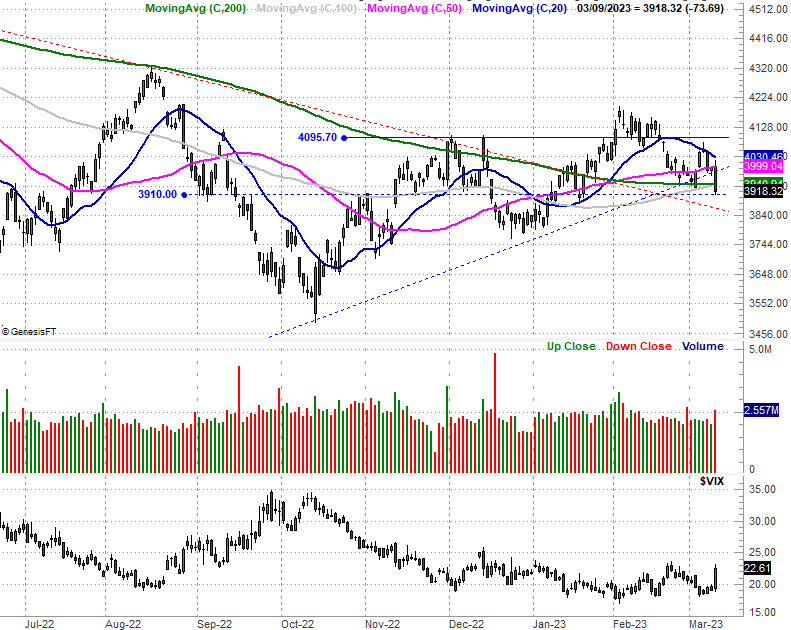
Source: TradeNavigator
Here's the weekly chart of the index for a little added perspective. There's no denying something changed dramatically, and for the worst. Also note the Volatility Index (VIX) seems to be pushing up and off of its falling support line that's served as a floor since September. This is as it should be. Notice there's plenty of room for the VIX to continue rising... which gives the S&P 500 room to continue falling.
S&P 500 Weekly Chart, with VIX and Volume
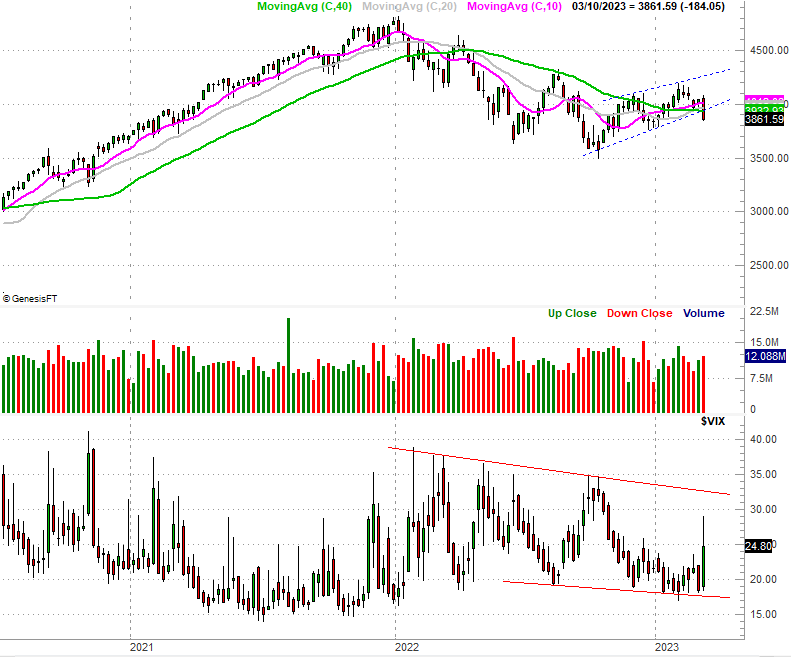
Source: TradeNavigator
The NASDAQ Composite is in a similar kind of trouble. Two weeks ago it was still holding above all of its key moving averages Now it isn't. The 100-day moving average line (gray) at 11,139 is the last line in the sand, and as of Friday it's under pressure. The 20-day moving average line (blue) has also been confirmed as technical resistance.
NASDAQ Composite Daily Chart, with VXN
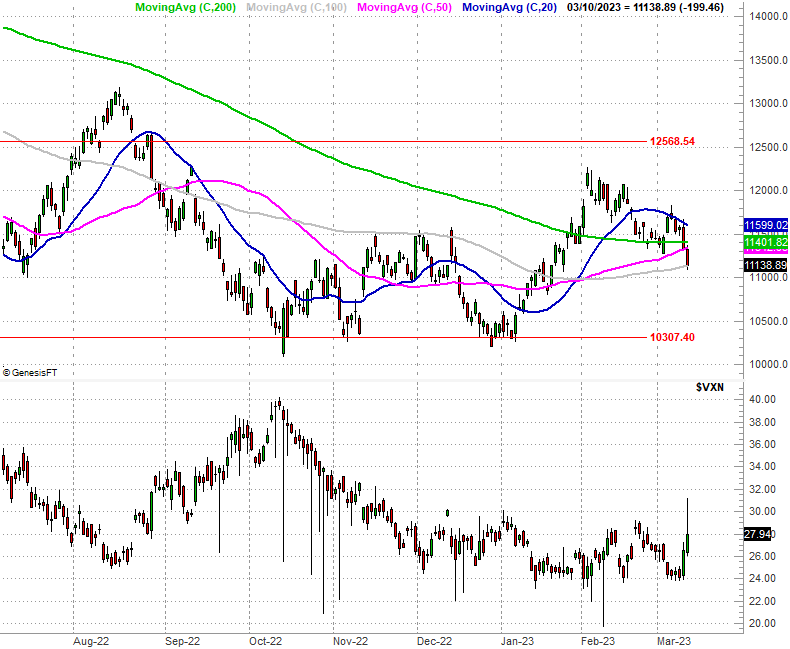
Source: TradeNavigator
The weekly chart of the NASDAQ doesn't show us anything new, but it does highlight a couple of noteworthy details. First, notice the 61.8% Fibonacci retracement level at 10,307 that sparked the rebound in October and renewed it in December is still waiting to serve as a floor again. Second, the NASDAQ's Volatility Index (VXN) is clearly finding support at 24.6. If the VXN can continuing pushing up and off of this floor, that works against the broad market.
NASDAQ Composite Weekly Chart, with VXN
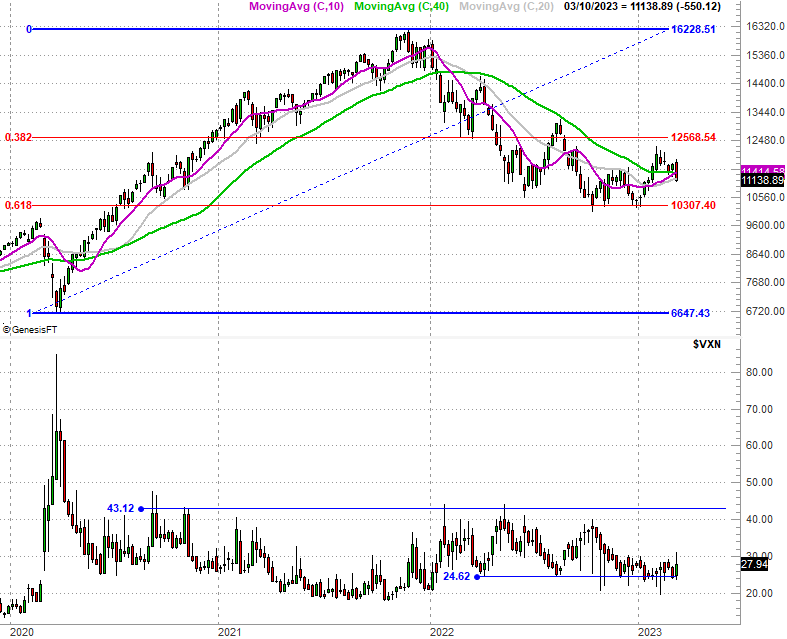
Source: TradeNavigator
The bottom line is, last week is the beginning of a technical breakdown... no doubt about. Although the market has seemed erratic -- even unpredictable -- of late, a closer look at both weekly charts above reminds us that both indices have actually made good on the hints of new rallies and pullbacks since early last year. Let's not dismiss this hint, particularly given how the volatility indices both appear to be pushing up and off of floors now.
The one thing working in the market's favor now? Last week was so bad (the S&P 500's worst week since June of last year) that it may be setting up a sympathy bounce from here. Just don't overreact if we see bullishness to start this week. It won't do any good until and unless the indices can fight their way back above their 20-day moving average lines.