Weekly Market Outlook - This is When Stocks Really Start to Heat Up
They dropped a hint they would do so a couple of weeks ago, and last week, the bulls did it. That is, they got back on the horse, and carried the market to a record high close last Friday.
 Granted, Thanksgiving week is almost always a bullish one, and likely a bit artificially bullish, as people -- with some time off - seem to equate consumerism with bullishness. With or without the psychological help though, the market is only following its usual day-to-day path, enjoying the usual year-end bullishness.
Still, there's a red flag waving.... again. We'll look at it after a quick review of last week's economic news and a preview of this week's economic announcements.
Economic Data
Last week's holiday-shortened workweek meant we didn't hear anywhere near as many economic reports as we normally might, and we were already slated for an inactive week anyway. In fact, the only items of interest to us were October's existing home sales (to start rounding out the real estate picture), and the prior week's crude oil inventory levels (to give us some perspective on the ongoing recovery in oil prices).
As for sales of existing homes, we were pleasantly surprised with an annualized pace of 5.48 million houses. The pace is picking up again on this front, but even more so on the new-home front with September's surge.
New and Existing Home Sales Charts
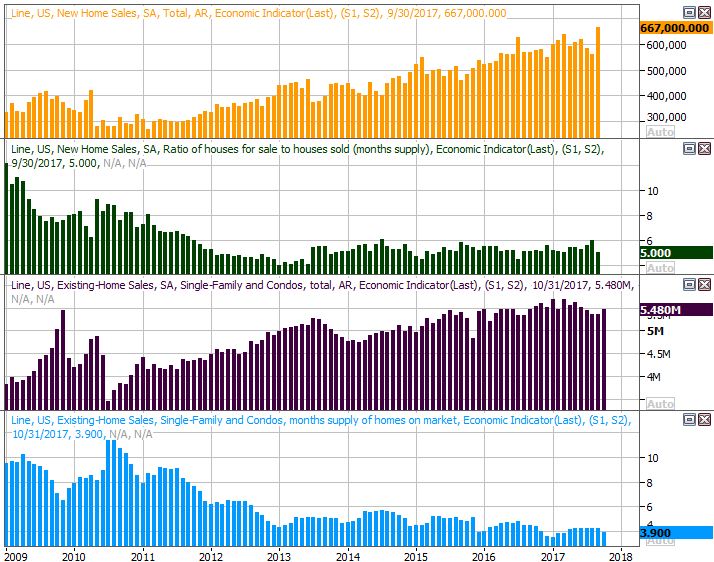
Source: Thomson Reuters Eikon
Once again, the strength here is made even more amazing in light of the fact that inventory of new and used homes remains not only muted, but shrinking. It's likely that's an effect of a couple of devastating hurricanes, but beneficial nonetheless.
On the crude oil and natural gas front, stockpiled levels of both fell... just a bit. Gas inventories were expected to fall for seasonal reasons, but the renewed downtrend in crude oil inventories is a secular one -- hopefully. One week in the right direction doesn't make a trend, but as you can see, the bigger-trend was already pointed downward.
Crude Oil, Natural Gas Stockpile Charts
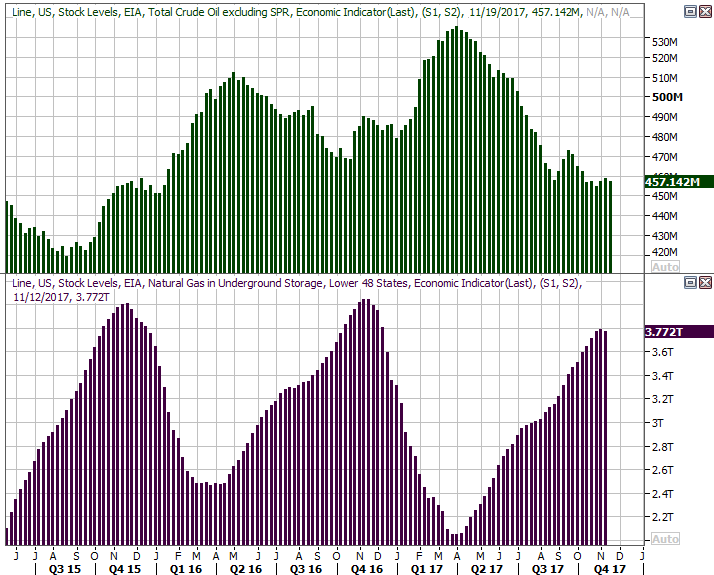
Source: Thomson Reuters Eikon
Another week of diminished inventory, and don't be surprised if the oil recovery tests prices of $60 per barrel.
Everything else is on the grid.
Economic Calendar

Source: Briefing.com
This week is going to make up for last week's lost time, beginning with the new home sales report for October on Monday. The pace is expected to slow from September's strong number, but the expected pace of 629,000 is still quite strong. The chart of the trend is above.
On Tuesday we'll get both the Case-Shiller Home Price Index report and the FHFA Housing Price Index. Both have been rising for some time, and are expected to continue doing so when it comes to September's reading.
Case-Shiller and FHFA Housing Price Index Charts
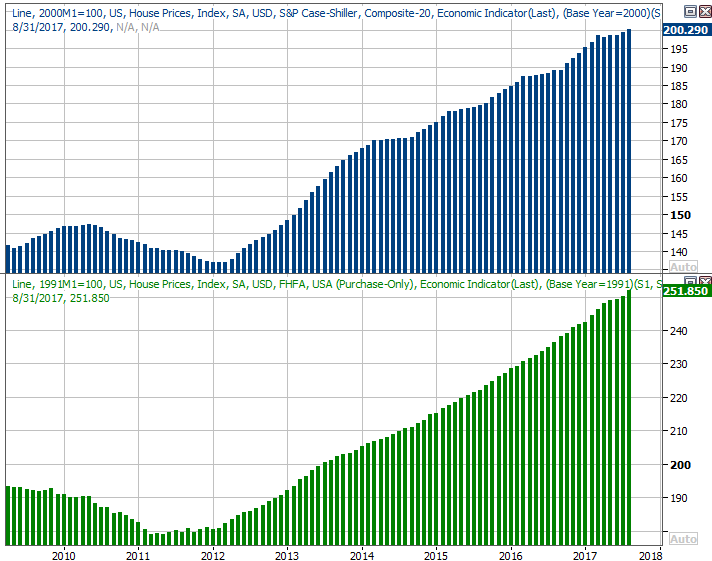
Source: Thomson Reuters Eikon
On Wednesday, keep an eye -- or ear -- out for the second quarter's second (of three) estimates. Economists are ratcheting up their guess from a growth pace of 3.0% to 3.2%, which has the potential to move the market for the better.
Also on Wednesday we'll get November's consumer confidence reading from the Conference Board. We heard the final Michigan Sentiment Index score last week. It was down from September's score, but still broadly trending higher, and is still high on an absolute basis. The pros are calling for a similar lull in the Conference Board's data, but the overall reading is still very, very high.
Consumer Sentiment Charts

Source: Thomson Reuters Eikon
We're also going to be watching Thursday's update on natural gas and crude oil inventory levels. More than that, though, on Friday we'll be closely watching November's automobile sales totals. We saw a surge in October, but mostly because of hurricane-related buying. It remains to be seen how much (if any) of that pace can be sustained. Indeed, there's a good chance that surge flushed out the last of the would-be car-buying, leaving behind a relatively low number of consumers ready to make such a purchase.
Automobile Sales Charts
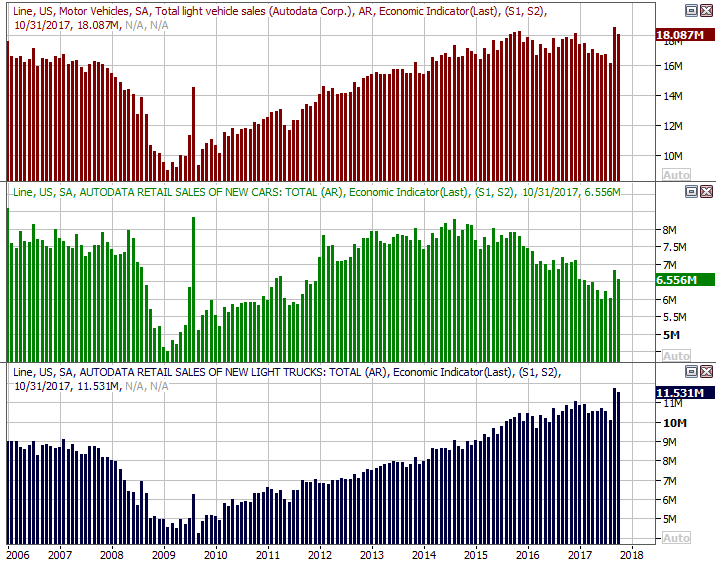
Source: Thomson Reuters Eikon
Index Analysis
From a momentum perspective, last week's gain wasn't just a gain. It was an official renewal of an uptrend that's been in place for an odd amount of time now.
The confirmation materializes on the daily chart of the S&P 500 with MACD lines and a PercentR indicator. On it, we can see the PercentR line was above the 80 threshold, pulled back a little with the market on Wednesday, and then moved higher again on the same day the S&P 500 itself moved to a higher high. This serves as evidence of the undertow. That's a prime opportunity for the bears to take a swipe and kick-start some profit-taking. The fact that they didn't speaks volumes about how serious the bulls are.
S&P 500 Daily Chart, with PercentR and MACD Lines
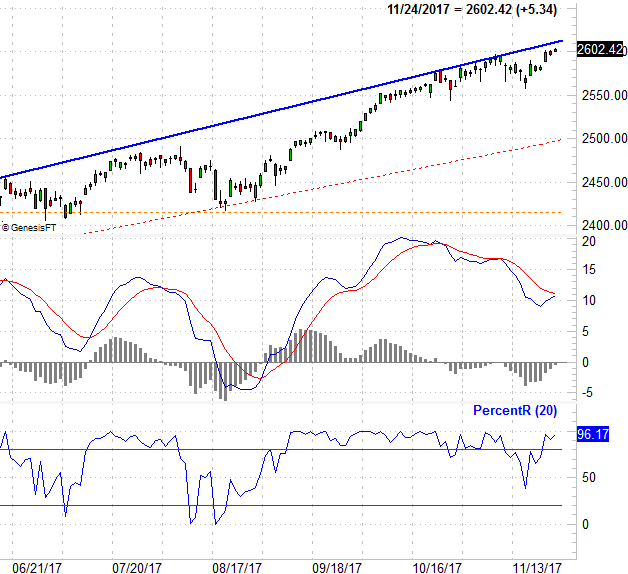
Source: TradeNavigator
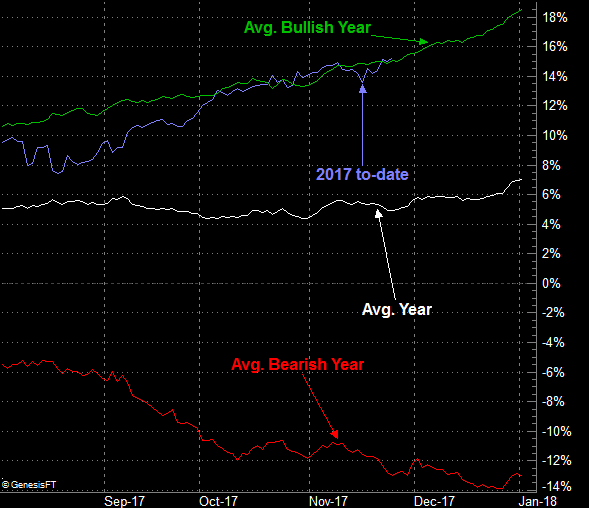
Of course, this is a bullish time of year anyway... usually.
Take a look at an updated chart of the index's usual day-to-day performance throughout the year. Though the average result of Thanksgiving week is a slow start then a bullish finish, in a "good" year, ironically, the week is lackluster. Not last week though. Last week, we made a sizeable gain, set up by the unusual pullback from two weeks ago.
S&P 500 Day-to-Day Performance Chart
Source: TradeNavigator
It's on this chart that we can also see that, as overbought as the market looks and feels right now, what we've seen thus far in 2017 isn't leaps and bounds better than the typical bullish year. In fact, it IS the typical bullish year, and it's supposed to get even hotter through the end of the year.
With that as the backdrop we can (and should) look at the conventional chart of the market's key indices in a better-informed light.
The S&P 500 is overbought -- there's no getting around that. On the other hand, it doesn't entirely matter... until it does. The index is very near the upper edge of a long-standing rising trading range (red, dashed), which is apt to put a lid on the rally. Problem is, it doesn't necessarily have to mean the market peels back to the lower edge of the range anytime soon, if at all.
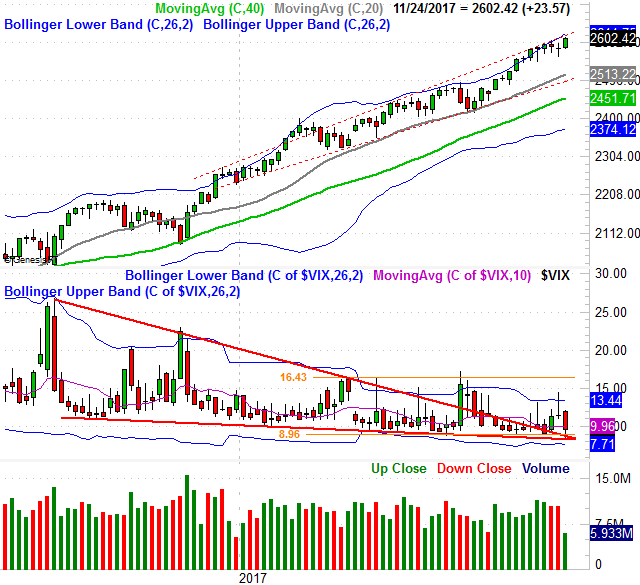
S&P 500 Daily Chart, with VIX and Volume
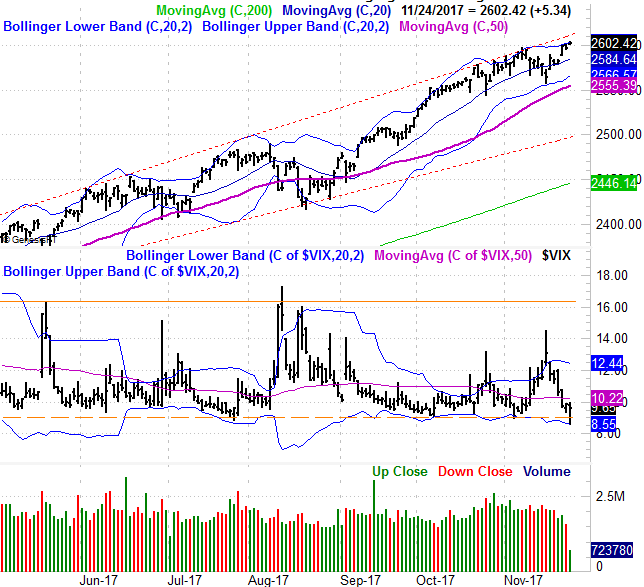
Source: TradeNavigator
Problem: The VIX hit rock-bottom levels on Friday, and has no room to move lower. In fact, the VIX itself logged an intraday reversal in an upward direction after kissing its lower Bollinger band and touching a new multi-year low.
It's a tricky scenario, however. Not only does a holiday break allow the market and its barometers to get skewed, the "too low" agreement hasn't meant much in a long while.
Still, zooming out to a weekly chart of the S&P 500 does show us how overbought the market is, and in need of a break. It also tells us we can't sweat things until the VIX gets and stays above its ceiling around 16.4. That should coincide with the S&P 500's break under the lower edge of its rising trading range, which is currently at 2497 (though rising fast).
S&P 500 Weekly Chart
Source: TradeNavigator
As for an outlook, this is still a 50/50, day-to-day affair. In a different environment or at a different time of year we'd probably be looking for a small dip. In this environment and this situation though, we have to look for the trend to remain in motion until we have a clear reason to think otherwise -- even if the VIX isn't playing the same song.