Weekly Market Outlook - The Bulls Stepped Up Just In The Nick Of Time

After three weeks of selling, stocks finally caught a break. The S&P 500 gained 1.9% last week, stepping back from the brink of a technical breakdown at the last possible moment.
The market's not quite back in a full-blown uptrend just yet. In fact, Thursday's and Friday's gains were so big that they'll be a tough act to follow this week. That's especially true in light of the fact that most of the indices only approached their 20-day moving average lines without actually pushing their way back above them. But, at least the bulls made a stand when they absolutely had to.
We'll look at the reversal effort in some detail in a moment. First, however, let's run down last week's biggest economic announcements and preview what's coming this week.
Economic Data Analysis
It was a busy week; we'll stick to the highlights.
We rounded out February's look at the real estate market on Tuesday, with updated pricing data. As was somewhat expected, both the Case-Shiller Index as well as the FHFA Housing Price Index slipped again (for December, though), underscoring overall weakness for the real estate arena.
FHFA, Case-Shiller Home Price Charts
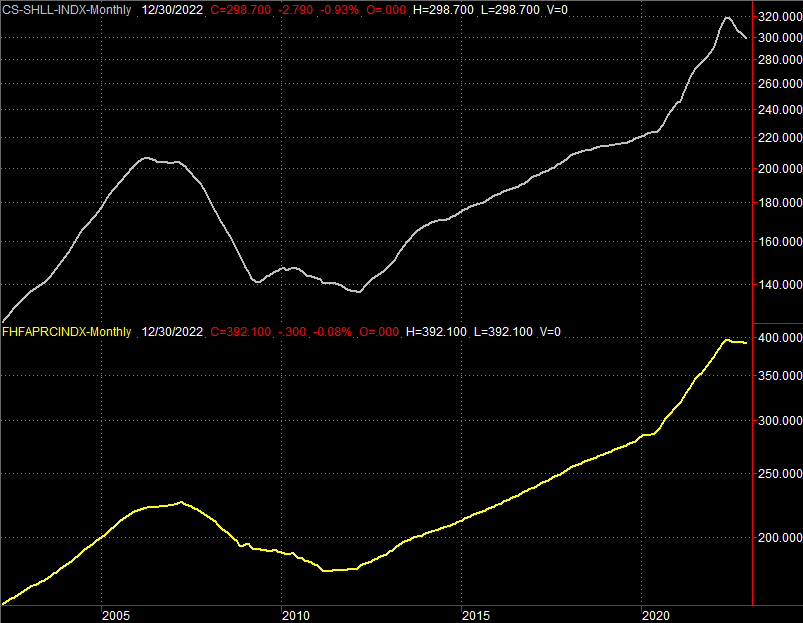 Source: Standard & Poor's, FHFA, TradeStation
There is chatter that the worst may be over for real estate. Given the history of real estate prices though, it seems unlikely we've seen enough price correction yet.
We also wrapped up last month's consumer sentiment snapshot with the Conference Board's consumer sentiment score, which fell a fair amount versus expectations for a slight improvement.
Consumer Sentiment Charts
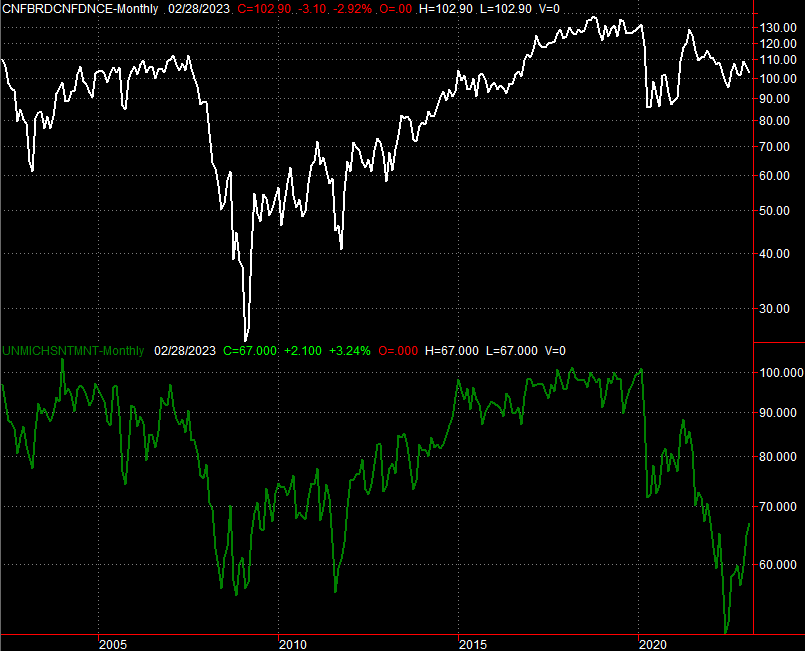 Source: Conference Board, University of Michigan, TradeStation
It's still not disastrous. And, note how the University of Michigan sentiment reading has actually continued to move sharply higher after bottoming in the middle of last year. This isn't the ideal sentiment backdrop for stocks, although it's not insurmountable.
Last but not least, we got February's Institute of Supply Management's service and manufacturing index updates last week. Manufacturing activity was flat, and held under the critical 50 level. But, services activity -- already above 50 -- remained near January's 55 level as well.
ISM Services, Manufacturing Index Charts
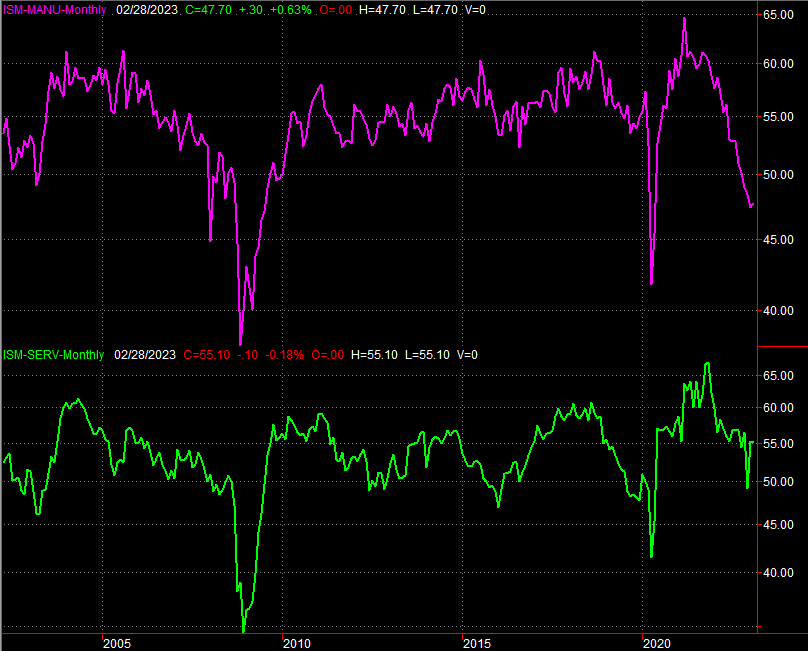 Source: Institute of Supply Management, TradeStation
The economy can't take much more of this continued deterioration of the ISM's manufacturing activity measure.
Everything else is on the grid.
Economic Calendar
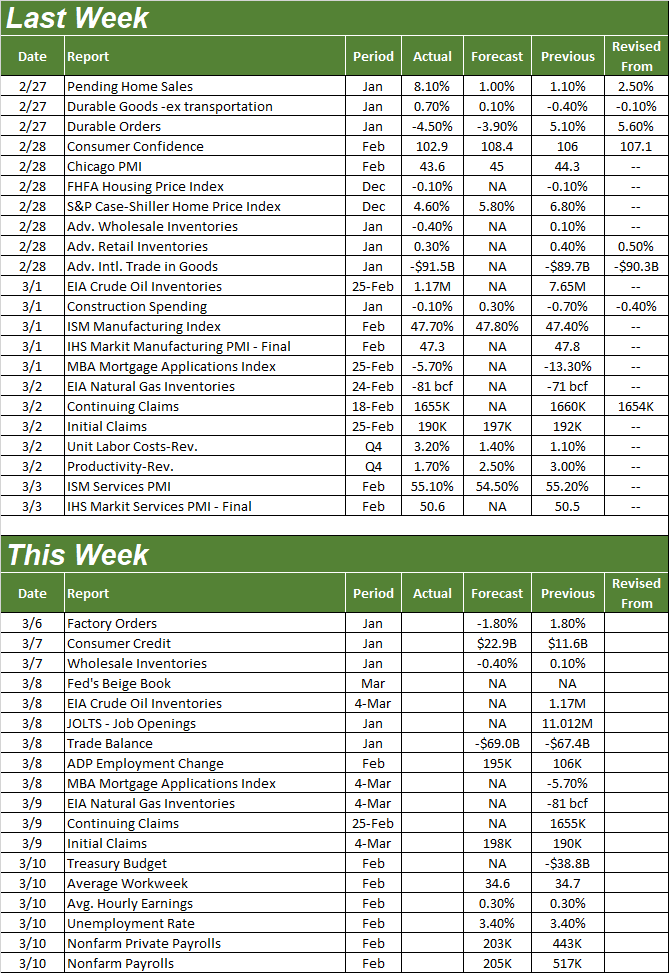 Source: Briefing.com
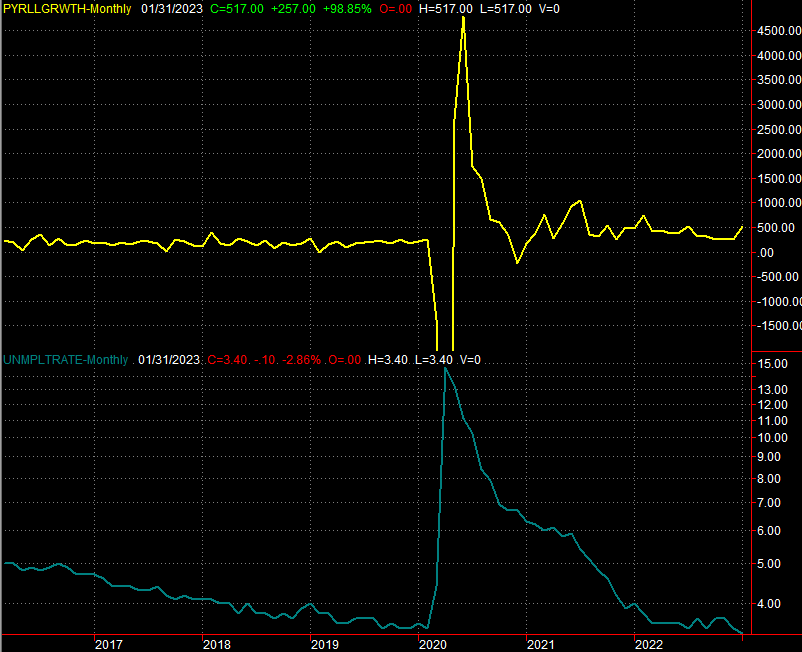
This week won't be quite as busy as last week was, but there's a biggie in the lineup... unemployment. February's jobs report will be posted on Friday. Payroll growth will likely fall from January's pace of 517,000, to only 205,000 for last month, which won't be enough to drive the unemployment rares lower. Then again, at 3.4%, it's tough to push the unemployment rate any lower than it already is.
Unemployment Rate, Payroll Growth Charts
 Source: Bureau of Labor Statistics, TradeStation
Either way, Friday's report has the potential to move the market... for better and for worse.
Stock Market Index Analysis
As of Thursday's open, the market was in serious trouble. Most of the indices opened the session at or under critical support levels. The bulls dug in immediately, however, and didn't stop buying until Friday's closing bell forced then to.
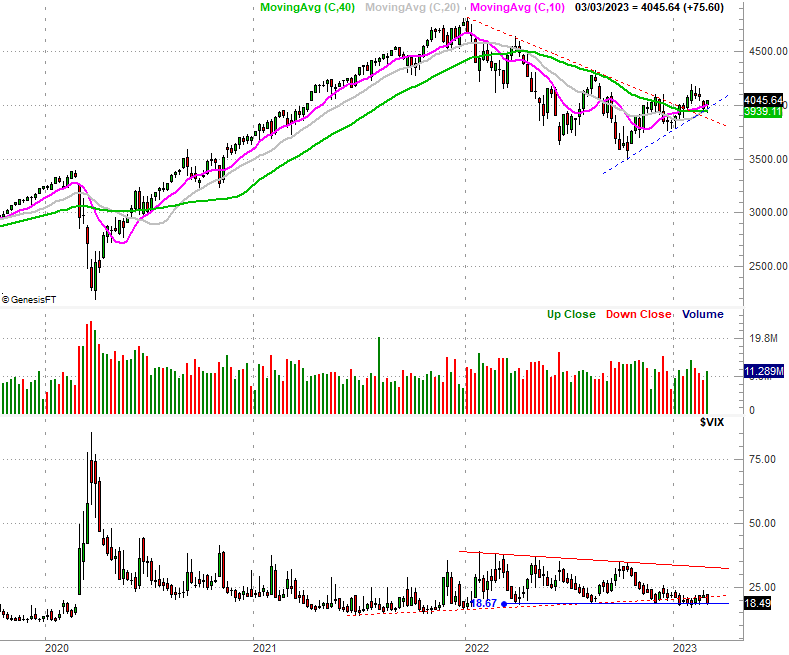
Take a look at the daily chart of the S&P 500 to see what we mean. It found support at the 200-day moving average line (green) on Monday as well as Wednesday, but didn't do so on Thursday. All it took was a kiss of the 100-day moving average line on Thursday, however, to ignite the pent-up buying. By the time Friday's closing bell rang, the index was even back above its 50-day line (pink), positioning to test the 20-day moving average line (blue) at 4062.
S&P 500 Daily Chart, with VIX and Volume
 Source: TradeNavigator
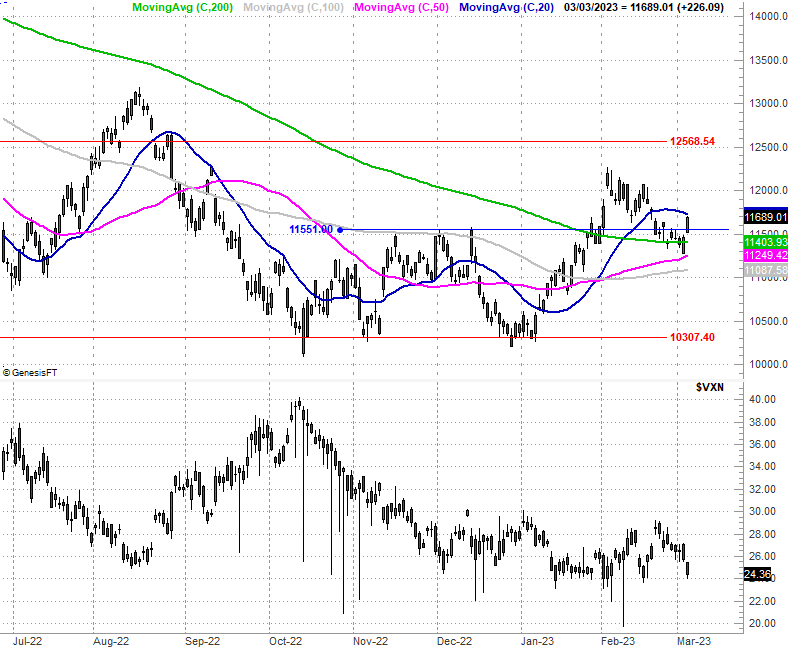
The NASDAQ Composite is showing is the same basic action. It tumbled under its 200-day moving average line (green) a couple of times last week, but Thursday's bearish opening gap was just too much opportunity for the bulls to pass up. The buyers plowed in, and kept buying all the way through to the end of the week. Of course, they stopped just short of the 20-day moving average line (blue) at 11,738. That's not the end of the world though. As it stands right now, they've got the momentum.
NASDAQ Composite Daily Chart, with VXN
 Source: TradeNavigator
We're not going to show it, but the Dow Jones Industrial Average is undergoing the same basic actions. That is, right before it fell too far to salvage, it managed to recover.
We are, however, going to show you a weekly chart of the S&P 500 so you've got a little more perspective on what's really happening here. Although the past month has been anything but decidedly bullish, we can see from this vantage point that the reversal effort that first took shape back in October is still technically intact. In fact, it almost looks like the nascent bullish effort just defined a new technical rising floor (blue, dashed).
S&P 500 Weekly chart bounceChart, with VIX and Volume
 Source: TradeNavigator
The only potential wrench in the works is the support the S&P 500's Volatility Index (VIX) may now be finding. Ideally, its floor - now firmly established at 18.7 will fail as a floor, thus fully releasing the budding rebound effort. Of course, the VIX doesn't necessarily have to move lower for stocks to continue moving higher. It just makes the job easier.
The trend is bullish, but don't get too excited just yet. Stocks are still mostly trapped between technical support and technical resistance. And, while the last layer of resistance is now within sight, there's some profit-taking potential now in play following Thursday's and Friday's sizable surge. Let's stay on the sidelines for now and let the bulls or the bears prove their mettle first.