Weekly Market Outlook - The Bulls Live to Fight Another Day

Once again the bear had their chance to deal a death blow to the market, and once again they failed to do so. And, once again the bulls capitalized on the opportunity, spurring stocks to record highs on Friday despite uncomfortably high valuations. Enough investors simply have faith that the future is going to be much healthier than the present (and the economic data mostly supports that theory).
Still, all thee buyers have a nagging voice in the back of their heads.... the market is vulnerable here, with the rally being established on a flimsy foundation. It doesn't matter yet, but if and when it does matter, it'll matter a lot.
We'll look at the matter below, after dissecting some key economic information.
Economic Data
It was plenty busy last week in terms of economic news, but the party didn't really kick off until Thursday's producer price inflation report. It was up 0.1% with or without food and energy costs factored in, more or less as expected. On Friday we got June's consumer inflation numbers, and they were even more tame. In fact, on a month-to-month basis there was no overall inflation, and even on a core basis prices only grew 0.1%.
On a more-important annualized basis, were seeing the inflation swell from last year start to be curbed. This essentially means the Fed doesn't have to be aggressive with its rate hikes, as price increases are taming on their own. This explains Janet Yellen's mostly-dovish take at last week's congressional testimony.
Consumer, Producer Inflation Rate Charts
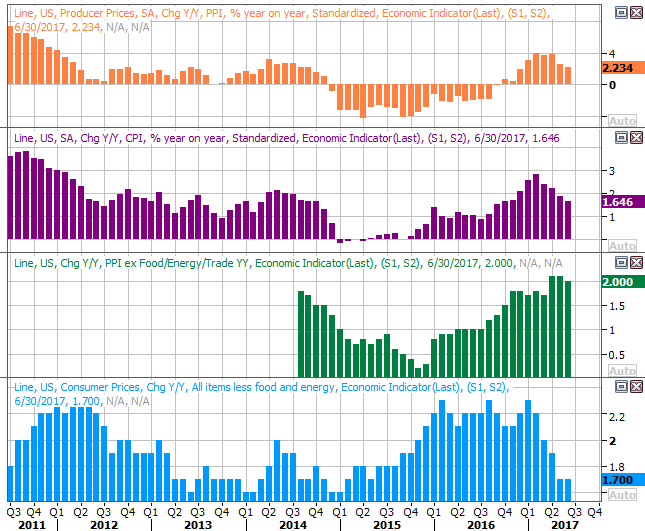
Source: Thomson Reuters Eikon
For the second month in a row (at least on a month-to-month basis), retail spending fell. Total spending was off 0.2% last month, with or without automobiles factored in.
It's a bit of a misleading figure. Like the inflation report, the more meaningful data would be a comparison of last month's spending to June-2016's spending. From that perspective, things are still growing, albeit at a slowing pace. Part of that slow-down is attributable to a tough comparison from a year earlier, but even on that relative basis that's concerning.
Retail Sales Growth Charts
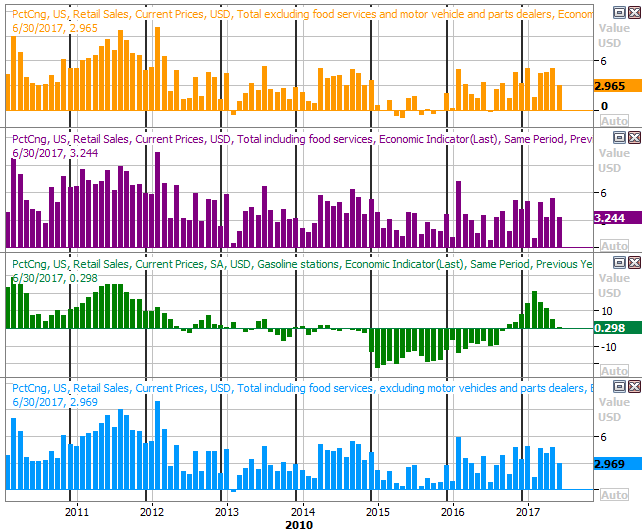
Source: Thomson Reuters Eikon
Finally, though it went largely unnoticed, last month's industrial productivity and capacity utilization were both better than expected, and both continued to edge higher after a rather miserable 2016. Production was up 0.4%, and capacity utilization of 76.6% was up from May's 76.4%.
Industrial Productivity and Capacity Utilization Charts
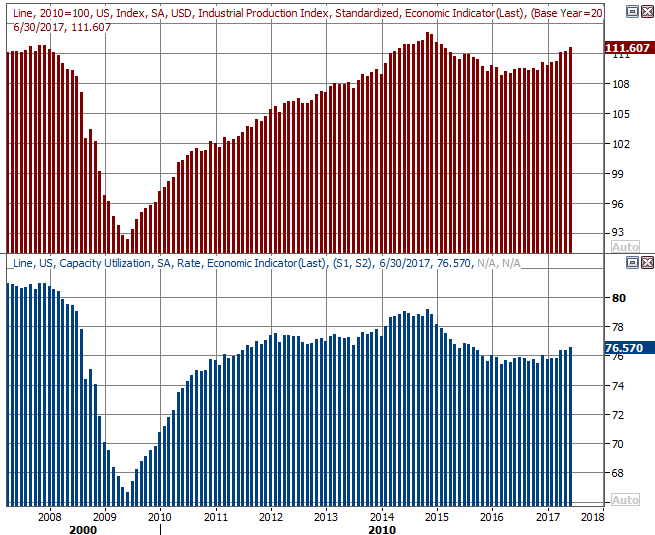
Source: Thomson Reuters Eikon
This is important data. Of all the economic data points available for review, these two show the strongest correlation with corporate earnings. To see these numbers rising suggests stocks may well grow into their lofty valuations after all (though not necessarily in a matter of weeks).
Everything else is on the grid.
Economic Calendar
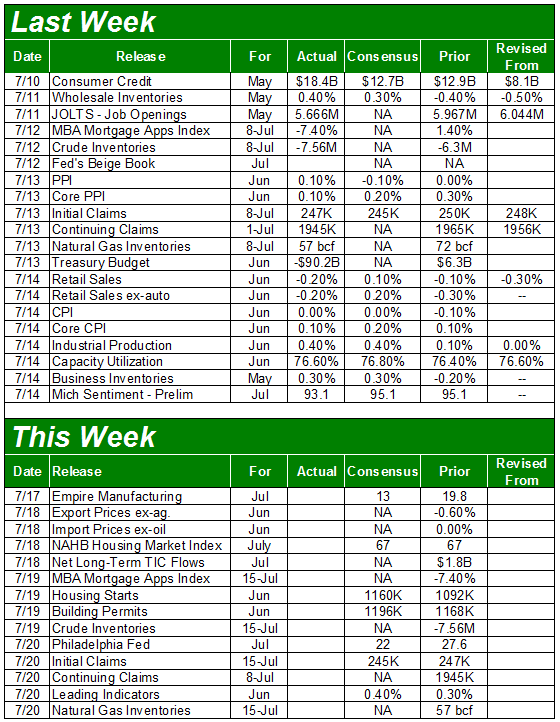
Source: Briefing.com
This week won't be nearly as busy. In fact, there's only one item of interest on the calendar... July's housing starts and building permits. The pros are looking for a little improvement on both fronts, and such strength would be welcomed. The homebuilding trend has hit a wall this year, and is getting close to getting alarmingly dangerous.
Housing Starts and Building Permits Charts
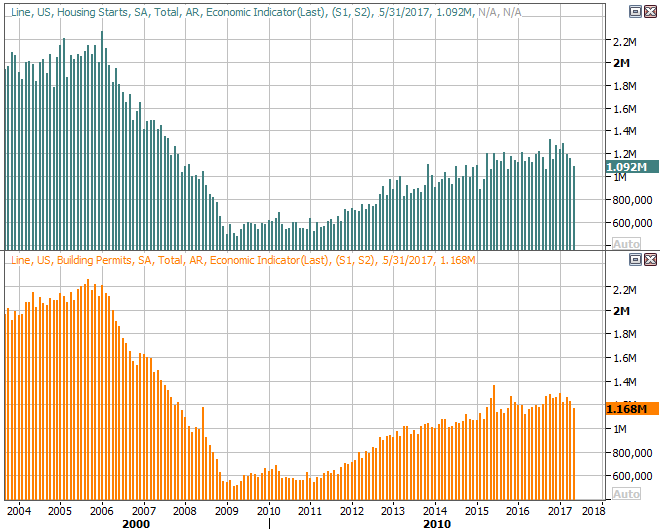
Source: Thomson Reuters Eikon
Index Analysis
The S&P 500's former ceiling at 2451? Breached, as of Friday. Not only did the bulls shrug off the semi-scandalous idea of Donald Trump Jr. meeting with a Russian operative during last year's presidential campaign, after thinking about for a while, it's almost as if they celebrated it.
It wasn't a move without its pitfalls though. Namely, the index is now a bit technically overextended, but the VIX is back to its absolute low of 9.5. With no more room for the VIX to edge lower, it's going to tough for the S&P 500 to keep moving higher.
S&P 500 Daily Chart
Source: TradeNavigator
Tough, but not necessarily impossible. Remember, stocks have been defying the odds -- and gravity -- for some time now. There's still no convincing evidence the buyers have any real intention of calling it quits now.
The weekly chart of the S&P 500 puts this in more perspective. This uninterrupted rally has become long in the tooth, pushing the VIX to absolute low levels.
S&P 500 Weekly Chart
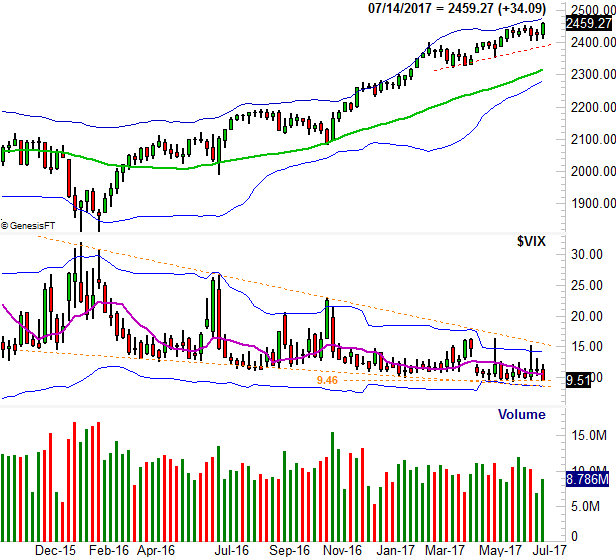
Source: TradeNavigator
It's noteworthy that the NASDAQ Composite didn't tiptoe its way into new-high territory. That's not to say it can't or won't happen. As the daily chart of the composite also shows us, the VXN does have plenty of room to keep falling before reaching its more absolute floor.
NASDAQ Composite Daily Chart
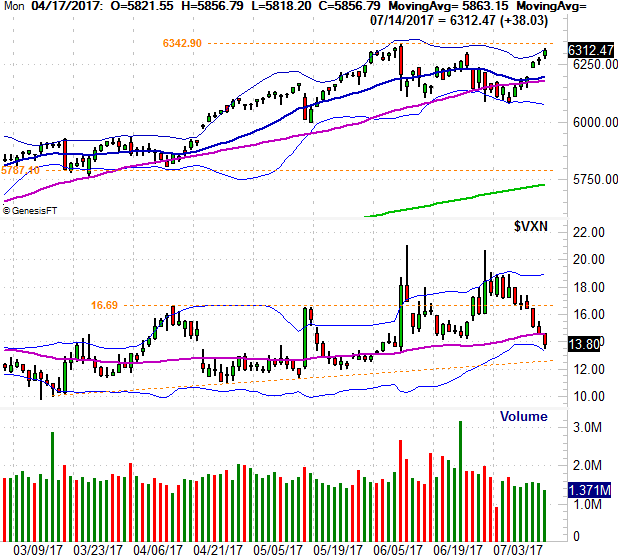
Source: TradeNavigator
Of course, a couple of other things stand out on the daily chart of the S&P 500 that are concerning, one of which is the fact that the NASDAQ left behind a gap with Wednesday's bullishness [the S&P 500 did the same]. Broadly speaking, the market doesn't like to leave gaps unfilled, which means we can expect downward pressure from here. The problem is, that downward pressure could kick-start a wave of panic selling.
The daily chart of the NASDAQ Composite also illustrates the fact that while last week's bullishness wasn't supported by any meaningful degree of volume.
Zooming out to a weekly chart of the NASDAQ we can get a little better feel for how last week's bullishness materialized. Take a look at the VXN. It had a great chance to finally break above the upper edge of a long-standing wedge pattern. It just didn't happen. Rather, the VXN retreated, rekindling the market's broad uptrend.
NASDAQ Composite Weekly Chart

Source: TradeNavigator
Putting it all together, we've got a lot to watch this week. While last week -- and Friday in particular -- was a winner, Friday's bullishness was already waning before the closing bell rang, and the S&P 500 anyway was beginning to struggle with the encounter with its upper Bollinger band.
We have to remain in the bullish camp based on the broad momentum, but as before, the market remains vulnerable. The 50-day moving average line (purple) currently at 2420 is a big one, but the real make-or-break level for the S&P 500 is the rising support line (dashed) currently at 2387, and rising.
Don't look for anything to become considerably clearer this week, which means look for the same back-and-forth chop until further notice.