Weekly Market Outlook - The Bulls Are Knocking on The Door. Will the Market Answer?

The market didn't end last week on a particularly high note. But, it did end last week with a gain, rekindling the rally that's got underway back in early March. The S&P 500 logged its highest high since mid-February last week, and remains in the hunt to keep on truckin' higher. Ditto for the Dow and the NASDAQ Composite, although the NASDAQ is still suspiciously stuck under a pretty well established technical resistance level.
We'll look at all of this in some detail in a moment. First, let's sift through last week's gauntlet of economic reports that painted an amazingly confusing picture.
Economic Data Analysis
Inflation is cooling. That's the long and short of it. While prices are still rising on a year over year basis, the pace of price growth continues to slow. The overall inflation rate for consumers now stands at a multi-month low of 5.0%; not including fuel and food, the rate is a slightly lower 5.6%. Producers are seeing even more cost relief, with the ex-food and ex-retail inflation rate now at a mere 2.7% on an annualized basis. These lowered costs may not have yet trickled down to the consumer level.
Annualized Inflation Rate Charts
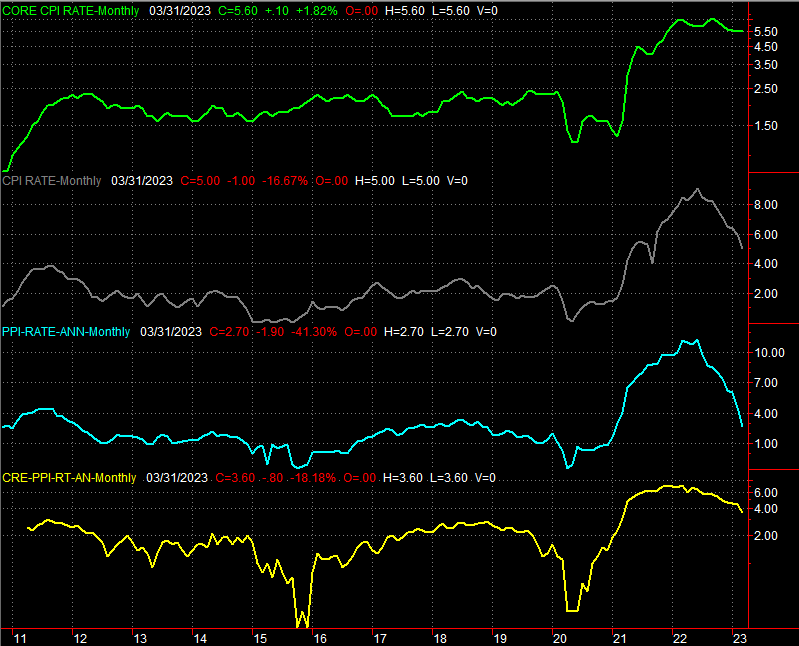
Source: Bureau of Labor Statistics, TradeStation
These producers -- factories -- are somewhat busier too. Although the utilization of our manufacturing capacity slipped slightly in March, actual industrial production grew to the tune of 0.4%.... a sizeable leap for this particular data set.
Capacity Utilization, Industrial Production Charts
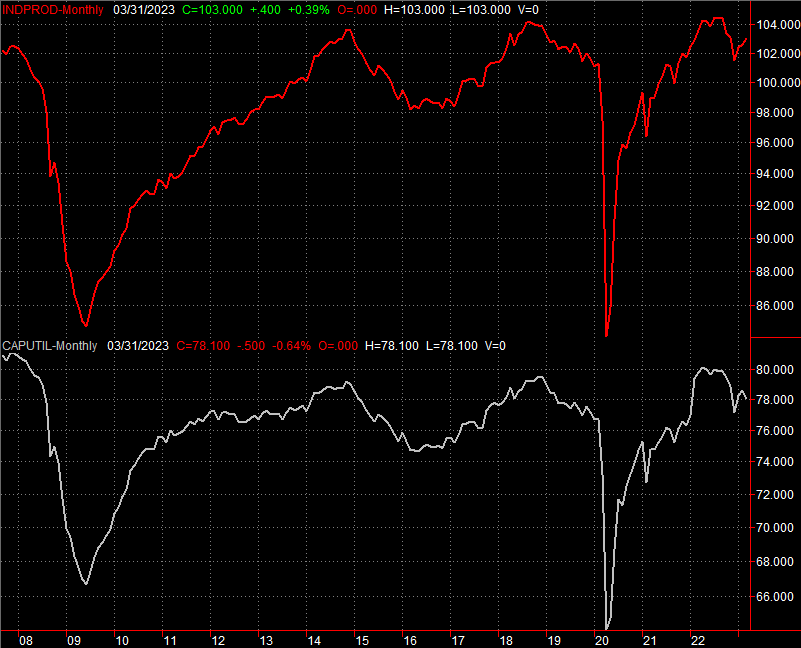
Source: Federal Reserve, TradeStation
Perhaps last week's big disappointment is March's retail sales. Economists figured they'd fall again following January's surge. They underestimated just how much they'd slide. Overall retail spending slipped about 1.0% last month after February's slight slowdown.
Retail Sales Charts
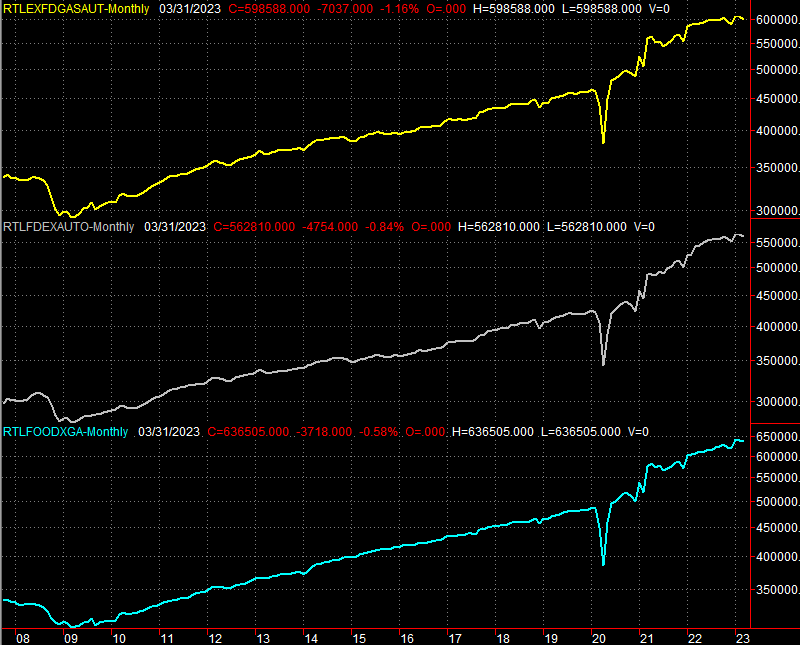
Source: Census Bureau, TradeStation
It's not the end of the world. While the trend is somewhat leveling off from late last year's firm consumerism, the longer-term trend remains positive. It's not great, but it's still positive.
Everything else is on the grid.
Economic Calendar
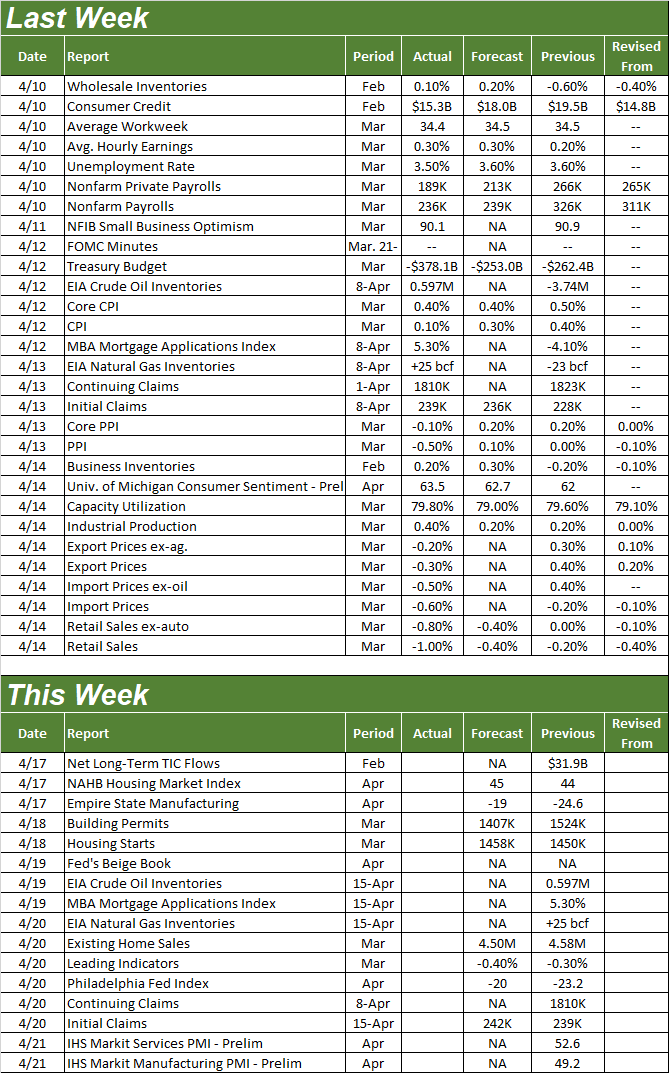
Source: Briefing.com
There are only two reports we're really concerned with this week. The first of these is Tuesday's look at last month's housing starts and building permits. Both have been recovering from last year's lull, though forecasters fear March's permits will see a measurable dropoff.
Building Permits, Housing Starts Charts

Source: Census Bureau, TradeStation
In the same real estate vein, look for March's sales of existing homes on Thursday. Like starts and permits, home sales plummeted last year in the wake of rising interest rates and a surge in home-buying in 2021; a little harsh economic reality didn't help things either. Sales have been improving since the beginning of this year, but economists believe that growth has flattened out in recent weeks... at least for sales of existing homes.
New, Existing Home Sales Charts
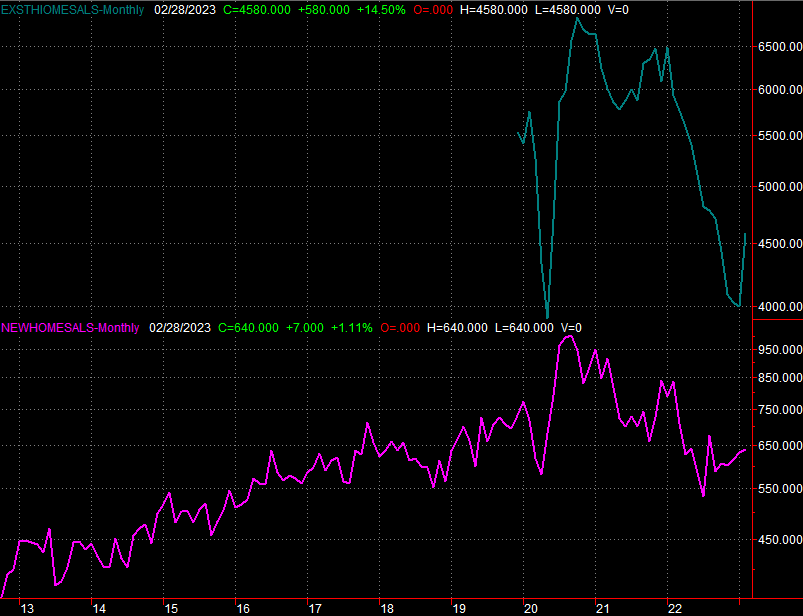
Source: Census Bureau, National Association of Realtors, TradeStation
March's new home sales figures will be reported next week.
Stock Market Index Analysis
Friday's action was less than bullish. But, the overall trend remains bullish.
The S&P 500 tapped a new multi-week high on Friday, ultimately ending in what ended up being a 0.7% gain for the week. The 20-day moving average line (blue) also crossed above the 50-day average (pink) on Friday. As a result, not only are all four key moving average lines now stacked bullishly -- with each shorter timeframe immediately above the next-longest timeframe --all four lines are now sloped upward. (This is a bullish nuance in and of itself.) Perhaps more noteworthy, though, is the fact that the S&P 500's volatility index (VIX) actually managed to break below its floor at 18.15; it didn't look like that was going to happen. Now that it has,it becomes much easier for the S&P 500 itself to make another bullish push.
S&P 500 Daily Chart, with VIX and Volume
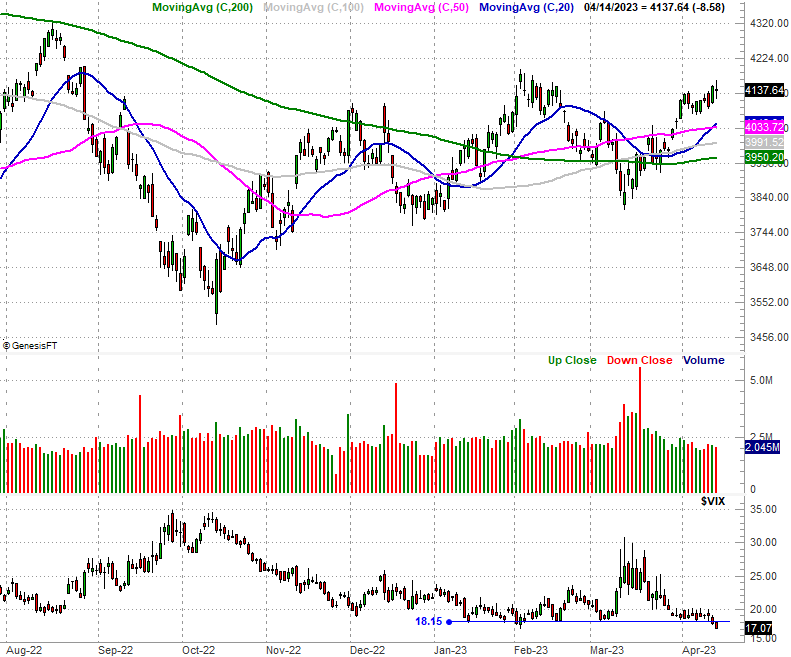
Source: TradeNavigator
Except, maybe the S&P 500 isn't quite over the hump just yet. And, perhaps the VIX isn't... well, under another important floor yet either.
Take a step back and look at the weekly chart of the S&P 500 index. The VIX broke under its horizontal floor (blue, dashed) at 18.15, but it's still just sitting on the lower boundary of its falling range in place since the middle of last year. It could still bounce. At the same time, the S&P 500 only brushed the line that connects the peaks from August and February (red, dashed) last week without actually getting up and over it. To see the VIX and the S&P 500 both bump into boundaries at the same time without actually clearing either one is at the very least a red flag.
S&P 500 Weekly Chart, with VIX and Volume
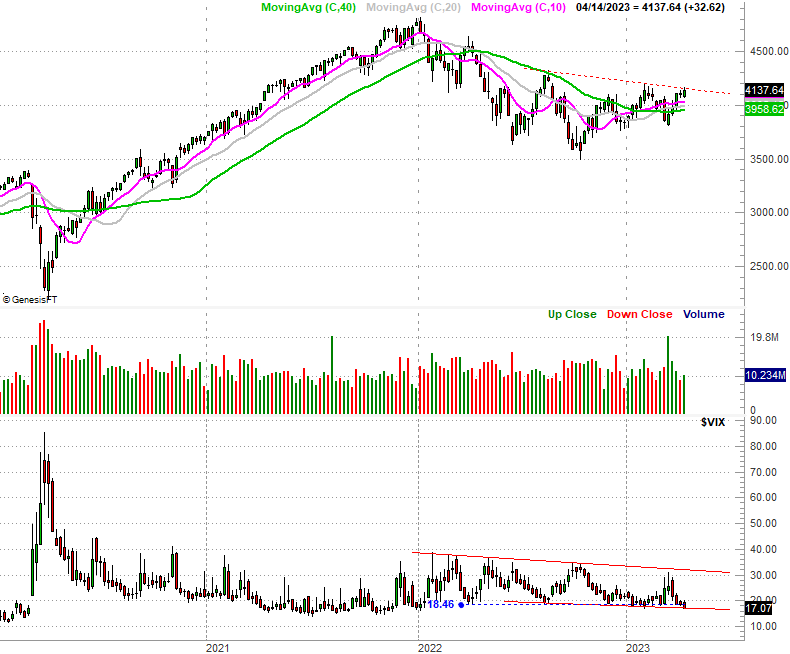
Source: TradeNavigator
And the NASDAQ Composite is in a similar sort of trouble.
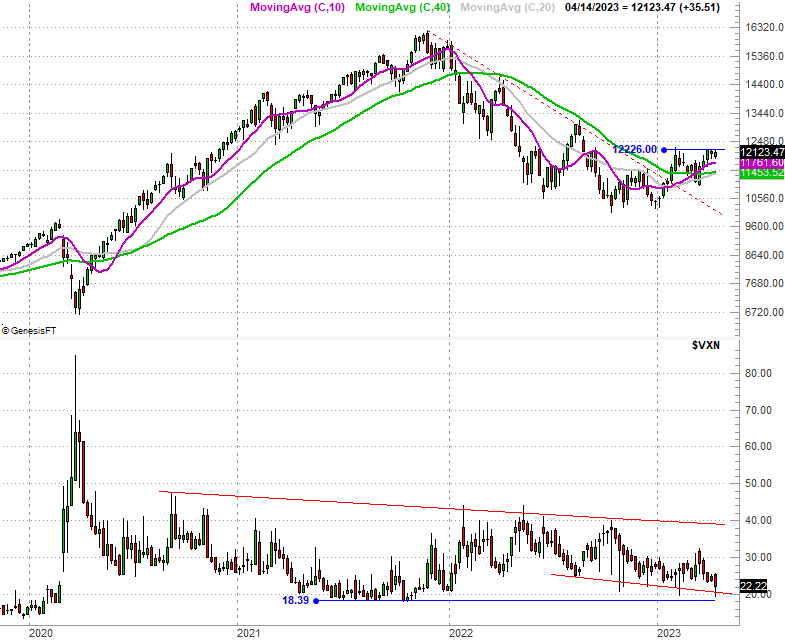
The resistance line at 12,226 that's been acting as ceiling since early February? It's still acting as a ceiling. Last week's high was just a hair under that mark. It was never threatened, even though the NASDAQ's volatility index broke under its floor at 23.6. That resistance got to be cleared first before anyone can truly entertain the idea of further upside.
NASDAQ Composite Daily Chart, with VXN
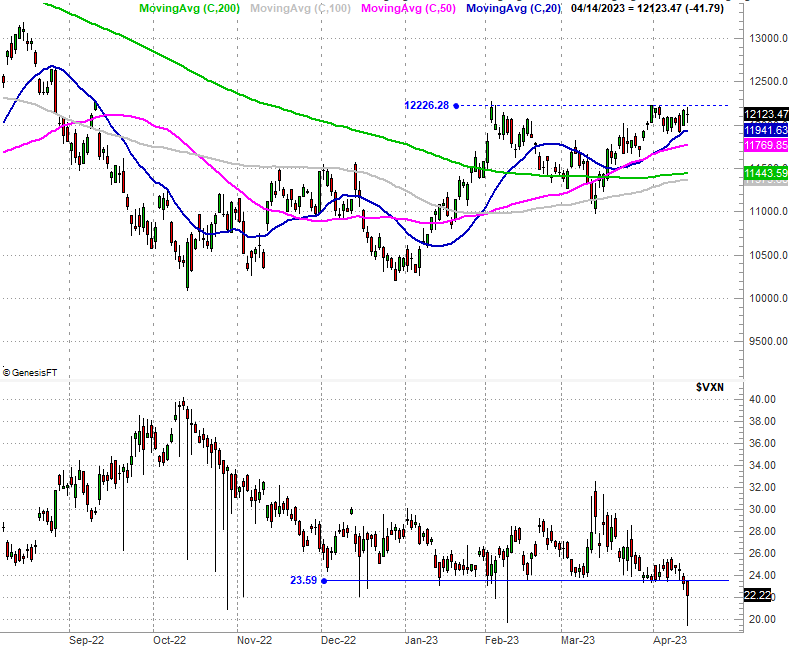
Source: TradeNavigator
Still, as we can see from the composite's weekly chart, the bear market's guideposts remain well breached, and we're standing in the shadow of at least higher lows. A move above 12,226 would not only make a much-needed higher high, but would very likely spark a measurable move higher.
NASDAQ Composite Weekly Chart, with VXN
Source: TradeNavigator
There's a little room for the VIX to edge lower as well, and as was noted last week, it's entirely possible for stocks to move higher while the volatility indices simply move sideways. That's not yet a bullish call though... just a possibility.
Bottom line? We should give the current uptrend the benefit of the doubt. But, it's not quite the right time to plow into new bullish positions. There's still some risk of a pullback here, and it's not like there's going to be a whole lot of opportunity-cost in waiting for better-developed, better-confirmed bullishness.