Weekly Market Outlook - Stocks Are Playing Too Much Defense to Even Worry About Playing Offense Here

The week ended on a high note, reversing the selloff that lasted through the very end of November to get October started on a bullish foot. But, even with Friday's sizable gains the stock market remains on the defensive. Friday's bounce may have been just that - a bounce, born from the sheer depth of the recent selling. The bulls still haven't stood up to a tough test just yet. Indeed, just a little more weakness early this week could still easily push stocks over the edge of a cliff.
We'll look at the tentative balance in a moment below. First, let's recaps last week's most important economic news and preview what's coming this week. The party ends with a report that could make or break the rally thus far, fully putting a long overdue correction into motion.
Economic Data Analysis
With nothing more than a look at the most circulated, discussed, and noisiest headlines, it would be easy to assume the worst about the current condition of the economy. Consumer sentiment plunged. The Conference Board's measure of consumer confidence fell back to February's levels, though perhaps more notably, the University of Michigan sentiment score that reached a multi-year low of 70.3 a month earlier only rebounded to 72.8 last month. People are feeling pretty discouraged.
Consumer Sentiment Charts
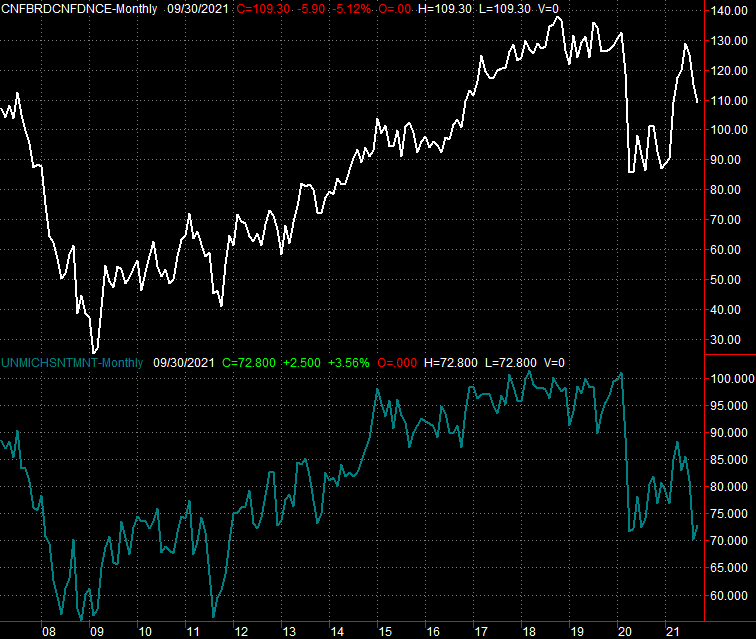
Source: University of Michigan, Conference Board, TradeStation
Don't blindly read too much into what consumers say they're feeling, however. Pay more attention to what they're doing. And what they're doing is (still) paying premiums for home purchases. Although the data is for July and not August or September, both the Case-Shiller Home Price Index and the FHFA Housing Price Index continued their march into record-high territory.
Home Price Charts
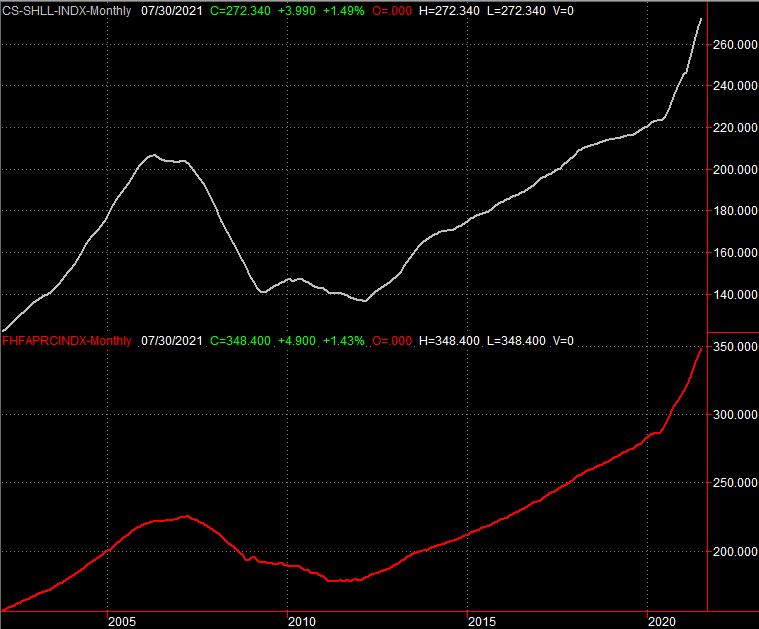
Source: Standard & Poor's, FHFA, TradeStation
Manufacturing managers also remain mostly undiscouraged. The ISM Manufacturing Index -- which is a poll of manufacturing executives' assessment of their companies' own business -- edged even higher again from August's already-healthy reading of 59.5.
ISM Manufacturing and Services Index Charts
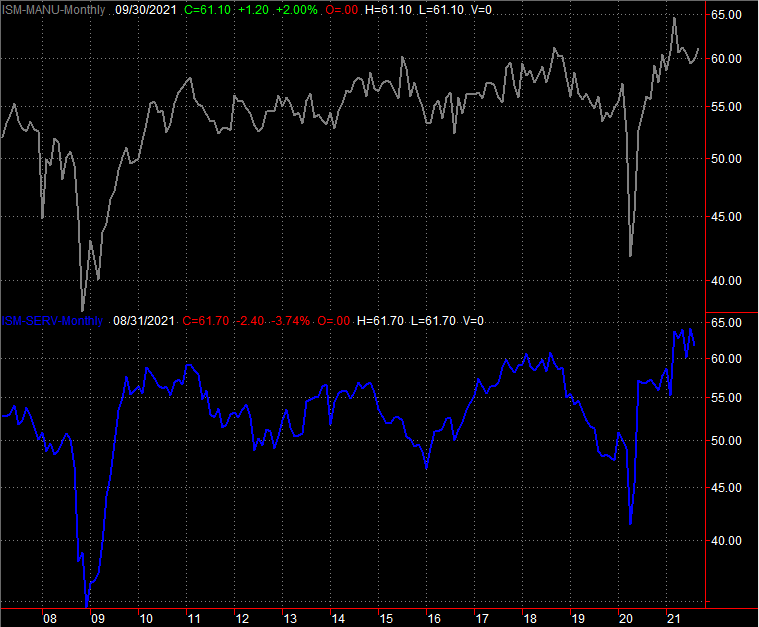
Source: Institute of Supply Management, TradeStation
The services version of the ISM's indices is coming this week. Economists are looking for a slight contraction on this front, but the expected reading of 60.0 is still very solid. Everything else is on the grid.
Economic Calendar
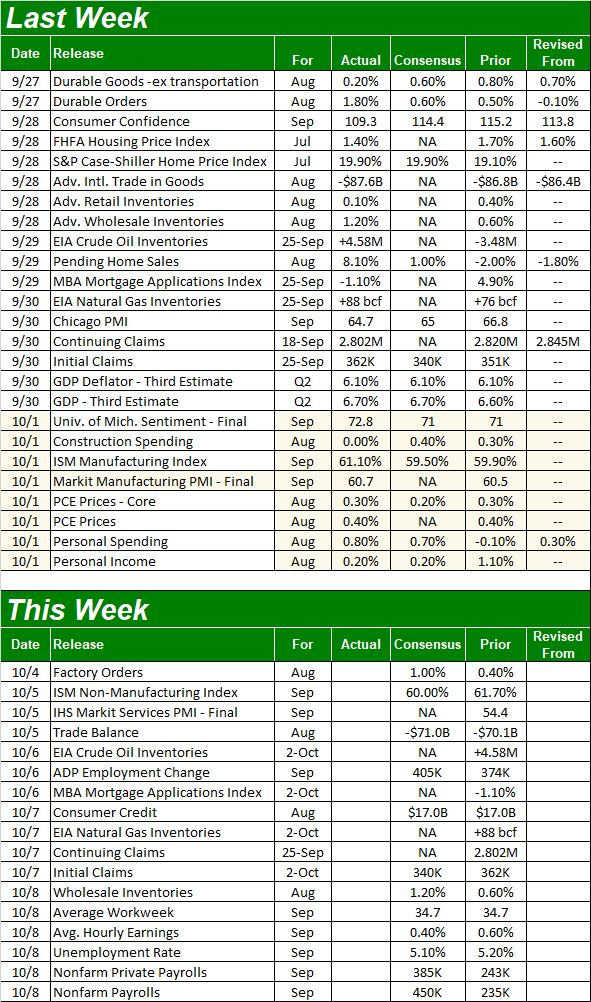
Source: Briefing.com
The ISM Services Index update is due on Tuesday, but there's little doubt as to the big news investors will be waiting on this week. That's Friday's jobs report. Forecasters believe the 450,000 jobs we probably added last month will drive the unemployment rate down from 5.2% to 5.1%.
Payroll Growth and Unemployment Rate Charts
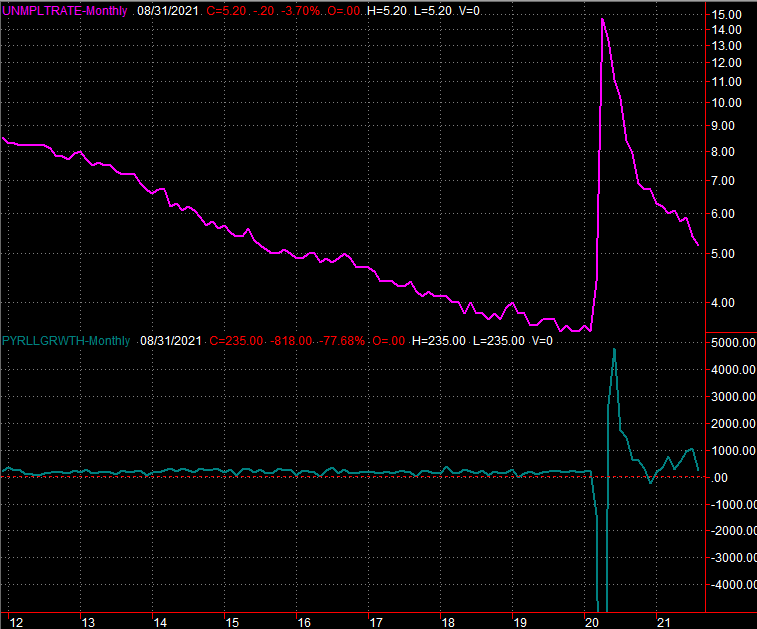
Source: Department of Labor, TradeStation
Do bear in mind that August's jobs report was surprisingly disappointing. We only added 235,000 new payrolls versus expectations of 720,000. That's not to suggest we'll have to log a repeat performance of that shortfall. But, it does indicate that economists may be overestimating job growth. It also explains why sentiment is still so lackluster.
Stock Market Index Analysis
The market bounced back on Friday after a rough middle of the week. But, that bounce hardly puts the market back in bullish mode. The moderate bullishness can largely be chalked up to the sheer scope of Tuesday's and Thursday's selloff. The S&P 500 still logged a loss of 2.2% for the five-day stretch, and the 20-day (blue) moving average line still closed under the 50-day (purple) moving average line for the first time in weeks. The one bright spot? Friday's intraday reversal was just enough to drag the S&P 500 back above the 100-day (gray) moving average line. Take a look.
S&P 500 Daily Chart, with VIX and Volume
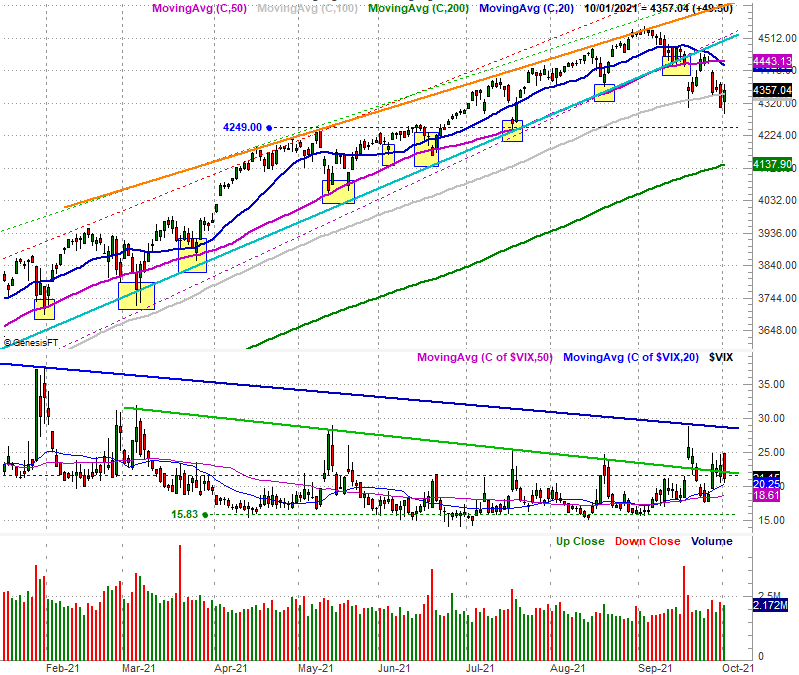
Source: TradeNavigator
The NASDAQ Composite did the same thing. That is, although it briefly broke under its 100-day moving average line (gray) at 14,508 on Friday, by the time the closing bell rang on Friday it was back above that mark. The long-tailed reversal bar also hints that the selling - at least for the time being - has run its course and transitioned back to net-buying. Just for kicks, we've also highlighted the past few times the bigger-picture rally has been rekindled by a brush with the 100-day moving average.
NASDAQ Composite Daily Chart, with VXN
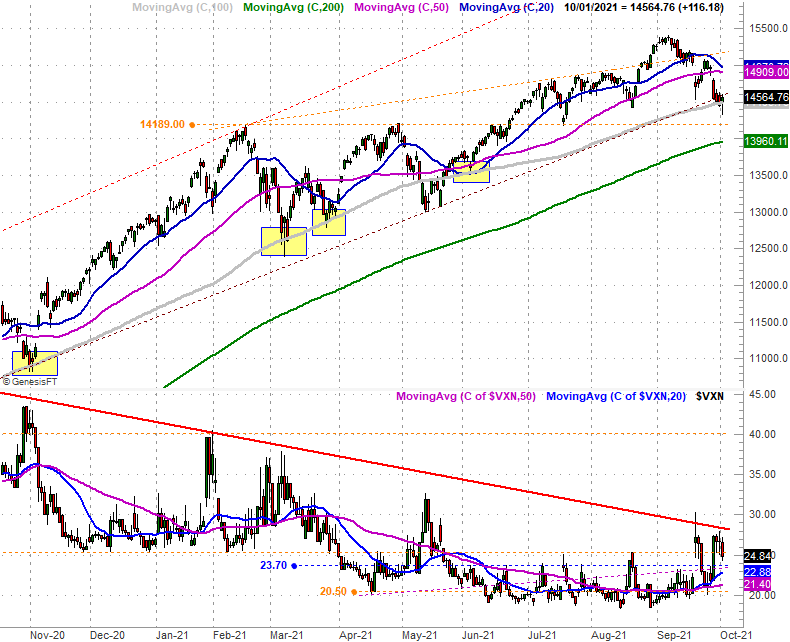
Source: TradeNavigator
Zooming out to weekly charts of both indices reveals a few more details that aren't readily apparent on the daily. Take the NASDAQ Composite's weekly chart below as an example. From this vantage point we can see the index at least briefly broke under the rising support line (dashed) that had connected all the major lows going back to June of last year. We can also see the NASDAQ's volatility index is toying with a break above the falling resistance line (solid, blue) that's been steering the VXN lower since last September. Traders are flirting with a significant redirection, even if they haven't pushed their way past the point of no return yet.
NASDAQ Composite Weekly Chart, with VXN
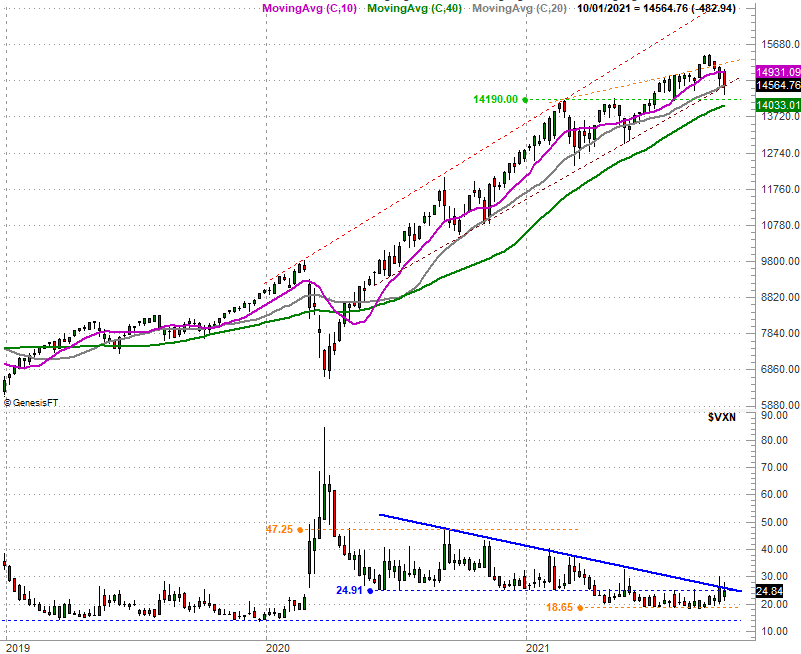
Source: TradeNavigator
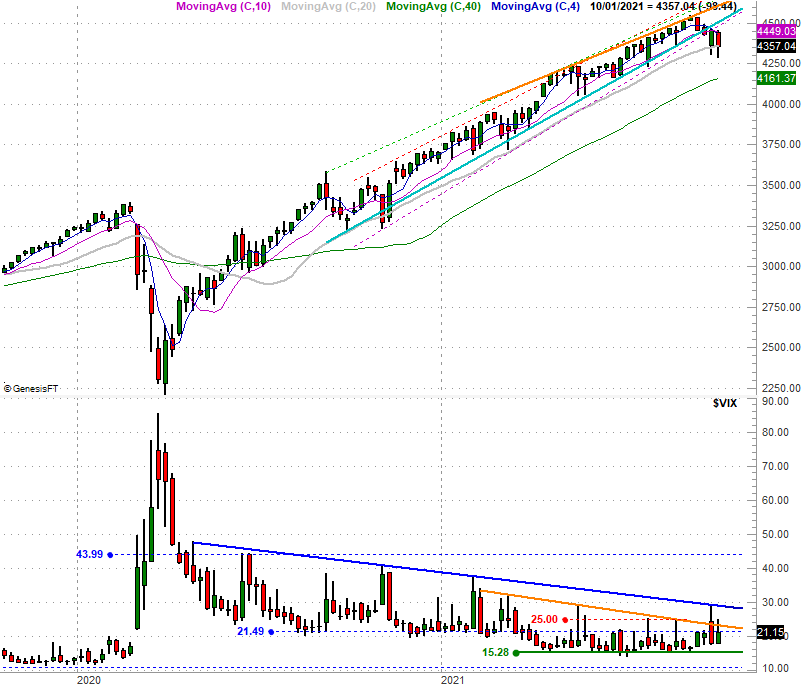
The weekly chart of the S&P 500 waves similar red flags. Like the NASDAQ the S&P 500 appears to be finding support at the 100-day moving average line, but that doesn't change the fact the S&P 500 has already broken below the lower boundary (light blue) of the converging wedge shape that's been guiding the index upward since late last year. Last week's action only added to that breakdown, putting a recovery - a move back into that trading range -- further out of reach.
S&P 500 Weekly Chart, with VIX
Source: TradeNavigator
This is still a situation that could go either way. Technically speaking things ended on a bullish foot on Friday, and the recent selling streak had already primed the pump for a good rebound. But, even if we do get a bounce that's not necessarily evidence that all is well. It will (still) take a push back above the 20-day and 50-day moving average lines, and we're still within striking distance of the 100-day moving average lines. The VIX and VXN are also within easy reach of their falling resistance lines that will push the market over the edge of a cliff. Keep close tabs on all of it. This could be the week... again.