Weekly Market Outlook - It's Way Too Soon to Start Sweating

OK, stocks logged a loss last week... the second week in a row it happened. A couple of the indices even briefly traded under key technical floors on Friday.
In some regards though, that lull may have been the very thing the bulls could have hoped for the most. The market was fighting back from Friday's early selloff when the week's closing bell rang, proving there are still some interested buyers out there. The lull also cooled off a rally effort that was quickly overheating. Now it doesn't have the pressure of maintaining that pace. It can regroup and then move forward at a more sustainable clip.
We'll look at the matter in some detail in a moment. First though, let's recap last week's big economic news, and preview what's coming this week.
Economic Data Analysis
It was a busy week to be sure, and on balance, a bullish.
The week's big news was of course inflation. There's still plenty of it. But, it continues to moderate. The overall inflation rate now stands at 6.4%... the lowest it's been since mid-2021, when it was on the way up. Not counting food and fuel, the annualized pace of price growth is now 5.6%. Producer's input prices are falling at a similar pace.
Inflation Rate Charts
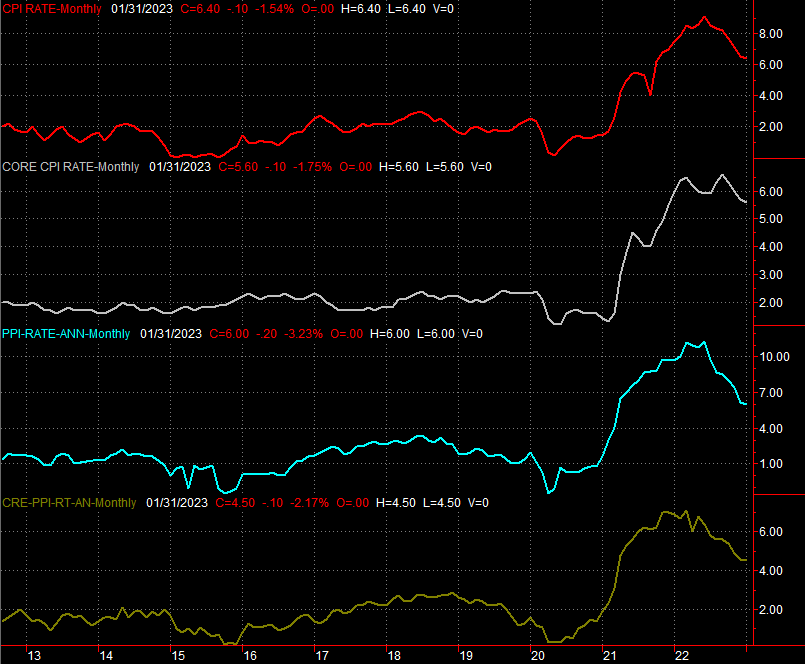
Source: Bureau of Labor Statistics, TradeStation
This is bullish in the sense that cooling inflation means the Federal Reserve can dial back on its hawkishness.
Except, the Fed may not want to be too quick to respond too aggressively to what looks like cooling inflation. Last month's retail sales not only improved, but improved far more than anticipated. Clearly consumers are feeling better about their current situation and their perception of the future. If they keep this up, they'll keep fanning the fans of inflation.
Retail Sales Charts
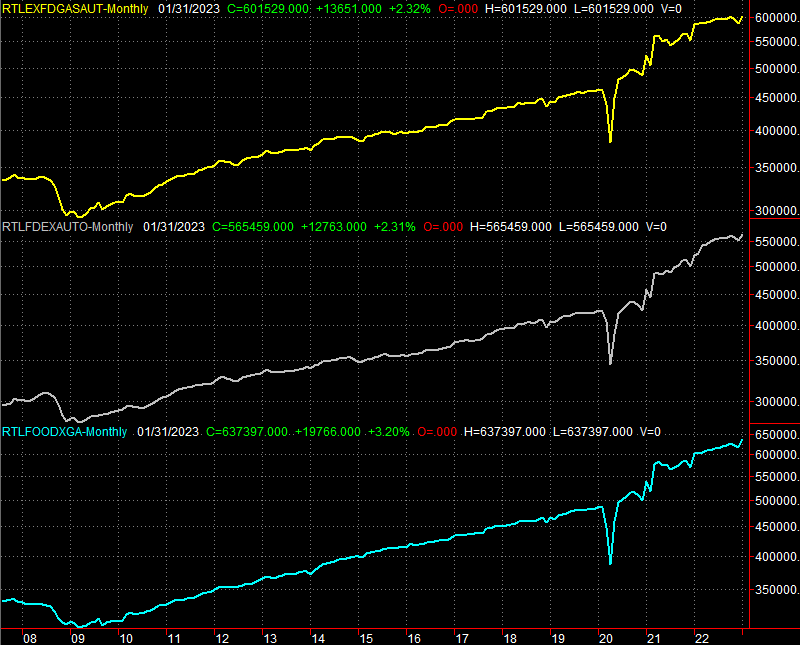
Source: Census Bureau, TradeStation
Still, there's good reason to believe the Federal Reserve's current slow pace of rate increases is the proper one. Last month's capacity utilization and industrial productivity were both less than impressive. Capacity utilization fell, and production was flat versus an expectation for a slight lift out of December's dip.
Capacity Utilization, Industrial Productivity Charts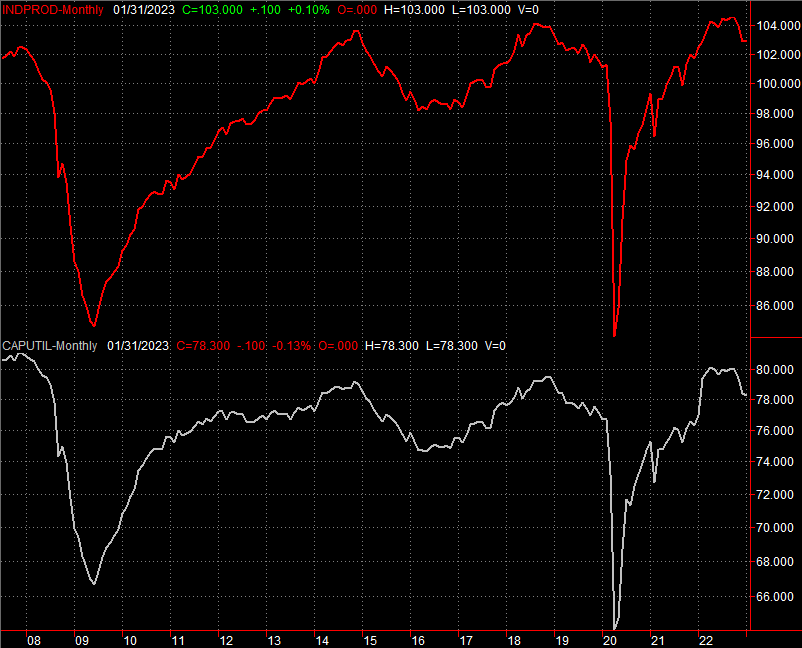
Source: Federal Reserve, TradeStation
In the same vein, housing starts and building permits continue to tumble. Permits somewhat leveled off at 1.339 million units (annualized), but that levels is near 2019's low point - with the exception of the setback suffered when the COVID-19 pandemic first started to spread in early 2020. Whatever the case, things are clearly moving in the wrong direction here. Just bear in mind the stock market and the housing market don't necessarily have to be tethered.
Housing Starts and Building Permits Charts
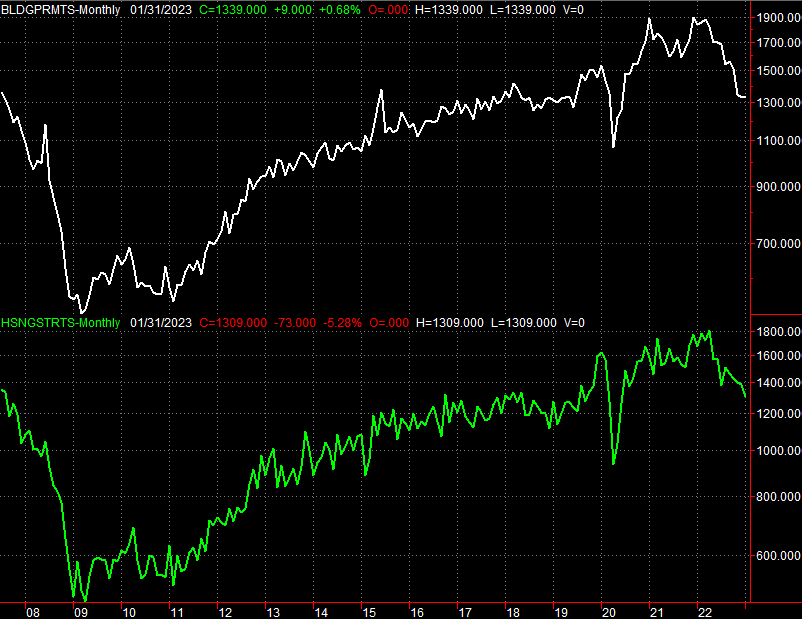
Source: Census Bureau, TradeStation
Everything else is on the grid.
Economic Calendar
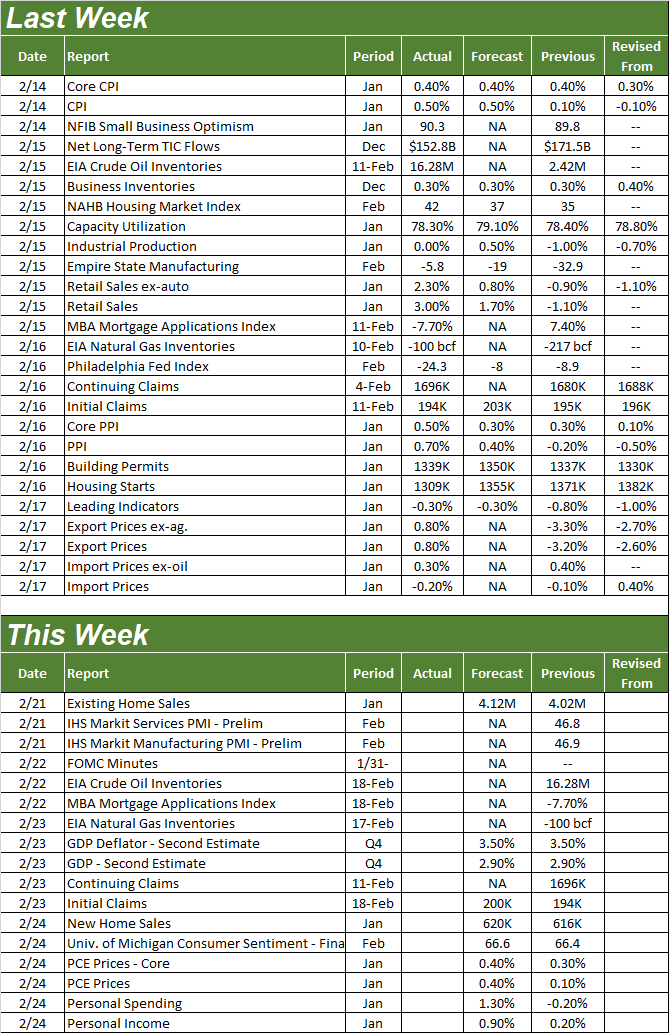
Source: Briefing.com
This holiday-shortened trading week is still pretty well loaded, particularly as it pertains to real estate January's sales of existing homes will be reported on Tuesday, following by Friday's look at last month's new home sales. Economist are calling for a slight improvement on both fronts, but modest progress from where we are now isn't exactly impressive.
New, Existing Home Sales Charts

Source: Census Bureau, National Association of Realtors, TradeStation
Also on Friday we'll get the third and final look at February's University of Michigan Consumer Sentiment Index, although we'll save that discission for next week when we get the Conference Board's measure of consumer confidence. Also notice the Fed will release the minutes from its most recent meeting on Wednesday of this week. This isn't a scheduled time to make a decision on interest rates, but the language within the minutes could be telling all the same.
Stock Market Index Analysis
Yes, the S&P 500 lost just a bit of ground last week, moving under a couple of key technical floors as a result. Even so, the recovery rally is still intact.
Take a look. The S&P 500 ended last week not only below a horizontal floor/ceiling around 4096, but also fell below its 20-day moving average line (blue) right around that same level. Other than that though, the index is holding above all of its other key technical lines that have converged tightly right around 3943. That's the key, and the clue that that the bigger-picture uptrend is still intact.
S&P 500 Daily Chart, with VIX and Volume
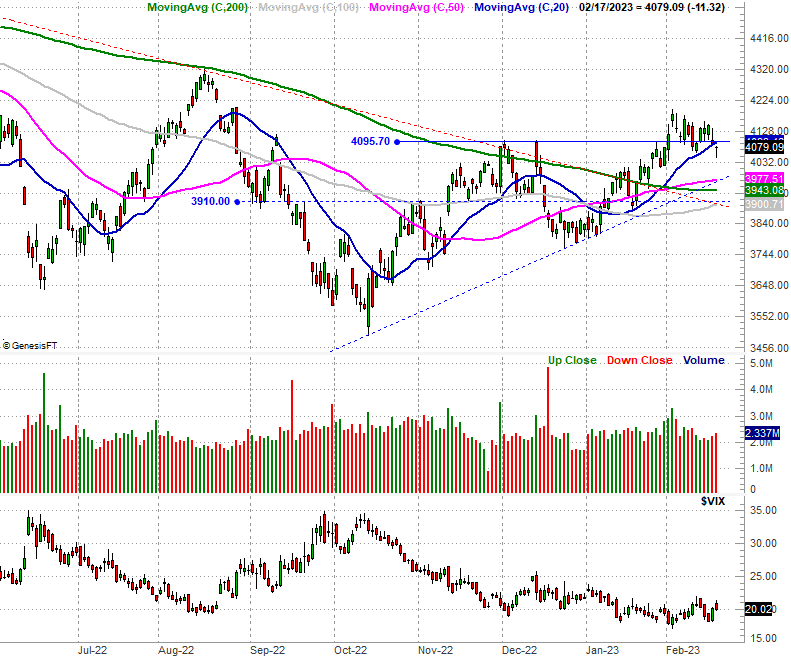
Source: TradeNavigator
The weekly charts puts things in better perspective. From this vantage point we can plainly see the break above the falling resistance line that defined the bear market from last January's high to the October low (red, dashed) remains breached.
S&P 500 Weekly Chart, with VIX and Volume
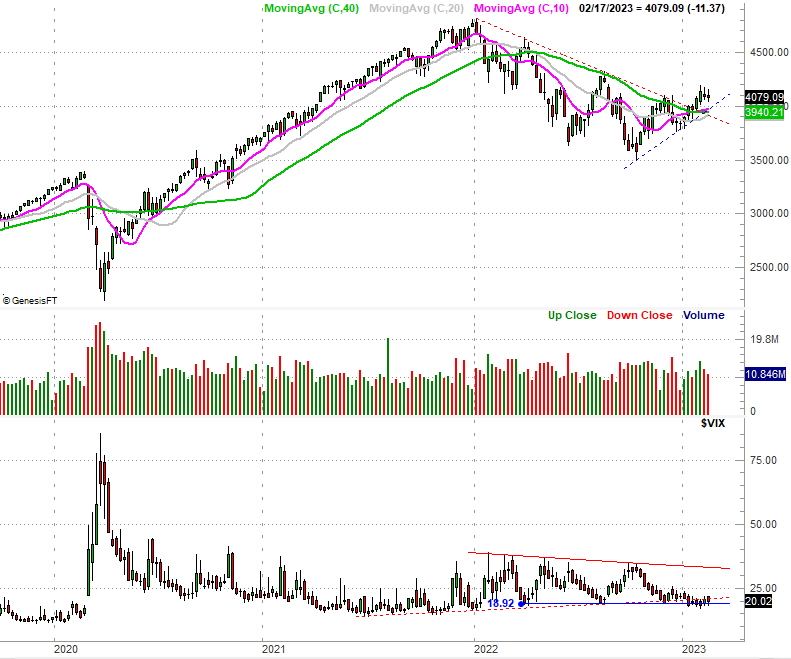
Source: TradeNavigator
The NASDAQ Composite looks about the same, although better. It briefly traded below its 20-day moving average line on Friday, but when push came to shove as the closing bell approached, the composite was able to fight its way back to that key moving average. Also notice it's still well above all of its other key moving average lines, and still well above the previous ceiling at 11,551.
NASDAQ Composite Daily Chart, with VXN
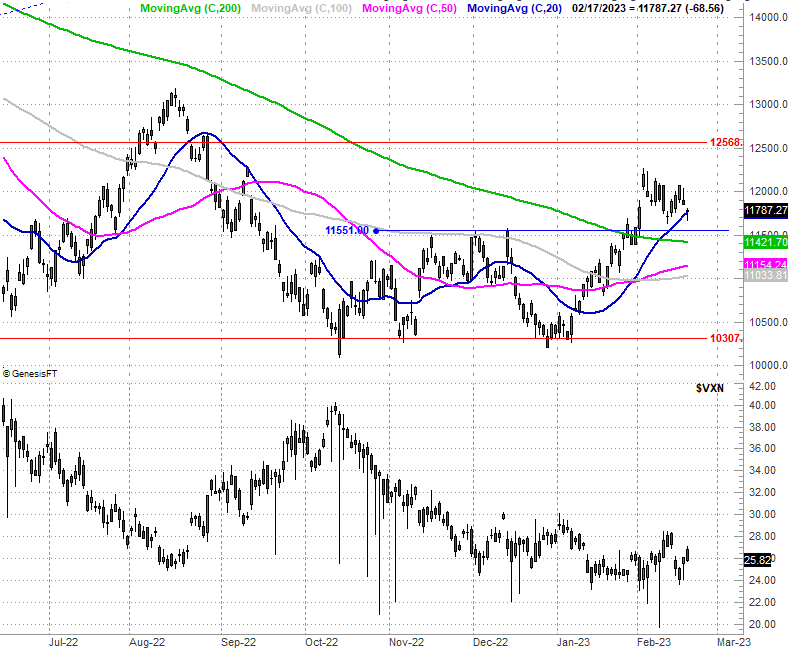
Source: TradeNavigator
Even the Dow Jones Industrial Average is holding up reasonably well.
You may remember we mentioned at the website a few days back that the Dow was suspiciously struggling now after holding up far better than the S&P 500 or the NASDAQ Composite. It seems like traders are seeking out risk again, at the expense of safer blue chips.
Dow Jones Industrial Average Daily Chart
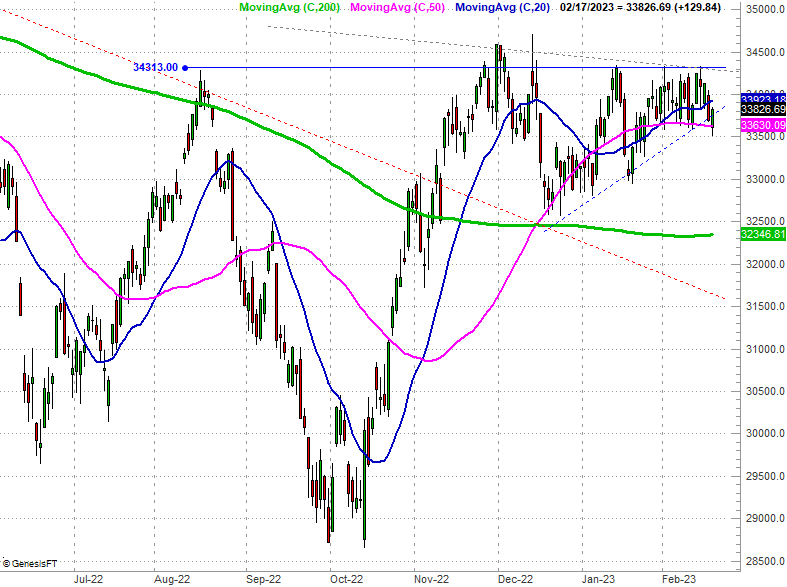
Source: TradeNavigator
Still, we'd like to see the Dow make its way above its recent technical ceiling at 34,313 to make this bullish effort complete. All three indices should be participating in it, even if not evenly. That's ok for now though. As long as the 50-day moving average line (purple) at 33,630 continues to hold up as support, the Dow Jones Industrial Average will remain within striking distance of that breakout.
The point is, last week wasn't a win, but in some ways it may have been the best thing that could have happened at this time. The bulls proved their mettle on Friday, and most of the key technical floors verified they're still acting as floors. Heck, there's actually room for a little more downside from the NASDAQ and the S&P 500 without breaking the uptrend.