Weekly Market Outlook - Despite Friday's Lull, The Market is (Finally) Over the Hump

It took some work and an uncomfortable amount of time. But, the bulls finally did it! The S&P 500 joined the NASDAQ Composite in its technical breakout. Now that this feat is complete stocks should have a much easier time moving forward.
That's not a guarantee, of course. In fact, there's still room and reason for the market to take a step back... even if only temporarily. There are plenty of technical support levels in place to keep any dip short-lived though.
We'll take a detailed look at the breakout in a moment. First, let's paint the bigger picture with the broad brush strokes of last week's major economic announcements.
Economic Data Analysis
Last week was pretty well loaded with important economic news. We'll just hit it in order of appearance, beginning with Tuesday's look at last month's industrial productivity and capacity utilization (or how much of the nation's factories' output capacity is currently being used). The data was just ok. Utilization edged a little higher from March's print, and production grew a bit after March's stagnation. And, it was much-needed progress. While not impressive, anything to extend the reversal of last year's dips is well-received.
Capacity Utilization, Industrial Productivity Index Charts

Source: Federal Reserve, TradeStation
Retail sales grew last month as well, reversing March's lull. Even so, consumer spending has essentially stalled since the middle of last year no matter how you slice it (although taking gasoline out of the picture, retail spending has grown just a bit). There's not enough convincing information here to come to any strong conclusion, bullish or bearish.
Retail Sales Charts
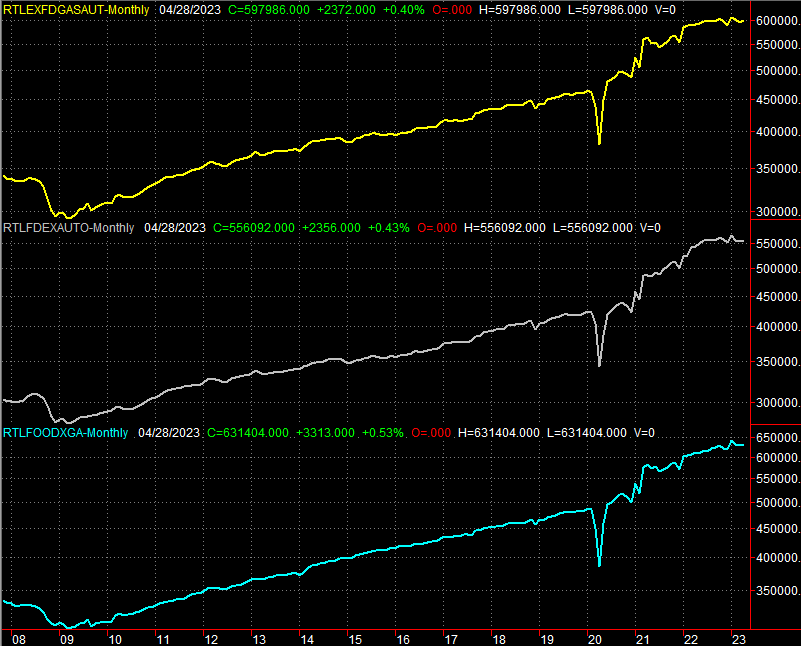
Source: Census Bureau, TradeStation
April's building permits and housing starts were lackluster too, although starts managed to move a little higher from March's reading. Even so, both sets of data are clearly still at poor levels without much sign of a bounceback (although homebuilder confidence is at multi-month highs, strangely enough).
Housing Starts and Building Permits Charts
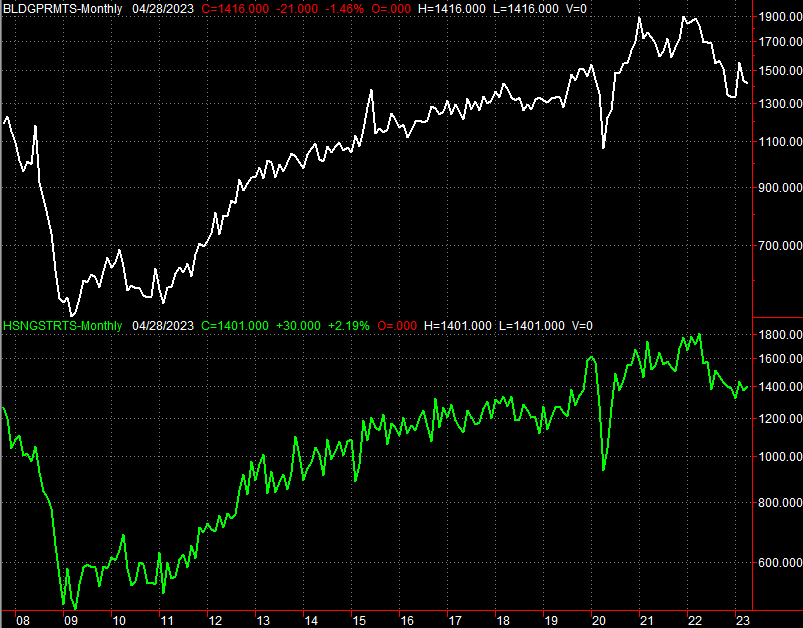
Source: Census Bureau, TradeStation
Everything else is on the grid.
Economic Calendar
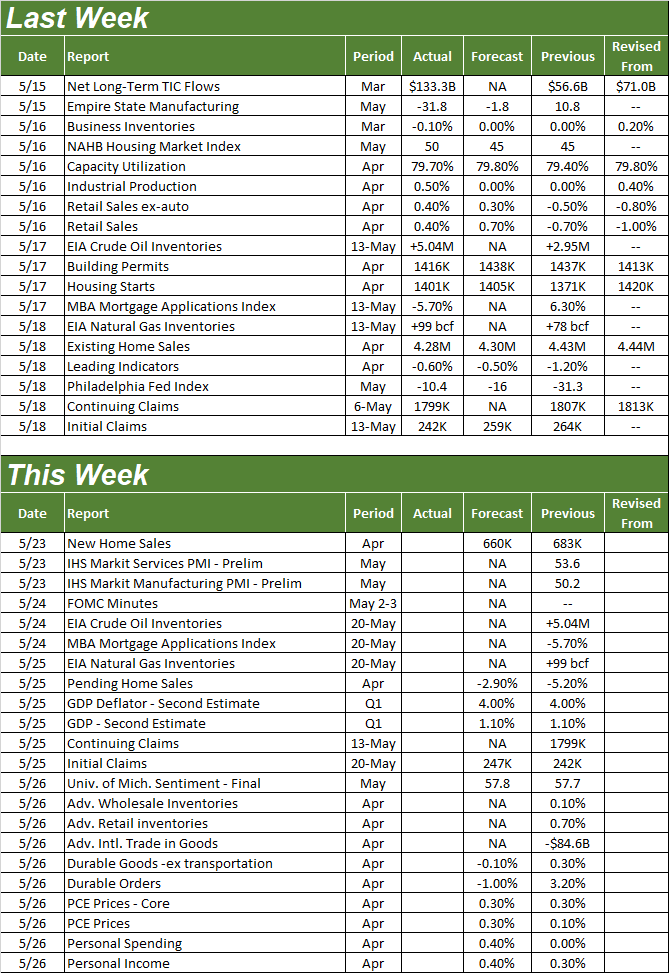
Source: Briefing.com
On Tuesday look for April's new home sales report, rounding out last week's look at sales of existing homes. The former is expected to fall, as the latter did. And, both remain in bigger-picture downtrends that suggest real estate is in bigger trouble than home prices currently suggest. Again, it's not clear what's driving so much optimism among homebuilders at this time.
New, Existing Home Sales Charts
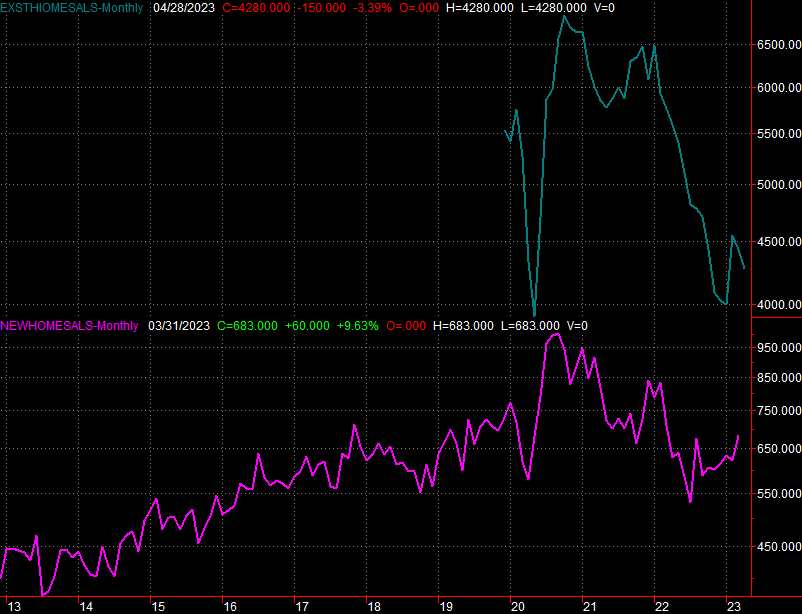
Source: Census Bureau, National Association of Realtors, TradeStation
Finally, although we won't get the Conference Board's look at May's consumer confidence score until next week, the third and final look at the University of Michigan Sentiment index for the month is coming on Friday. It's apt to sink, re-accelerating an already-rekindled pullback.
Consumer Sentiment Charts
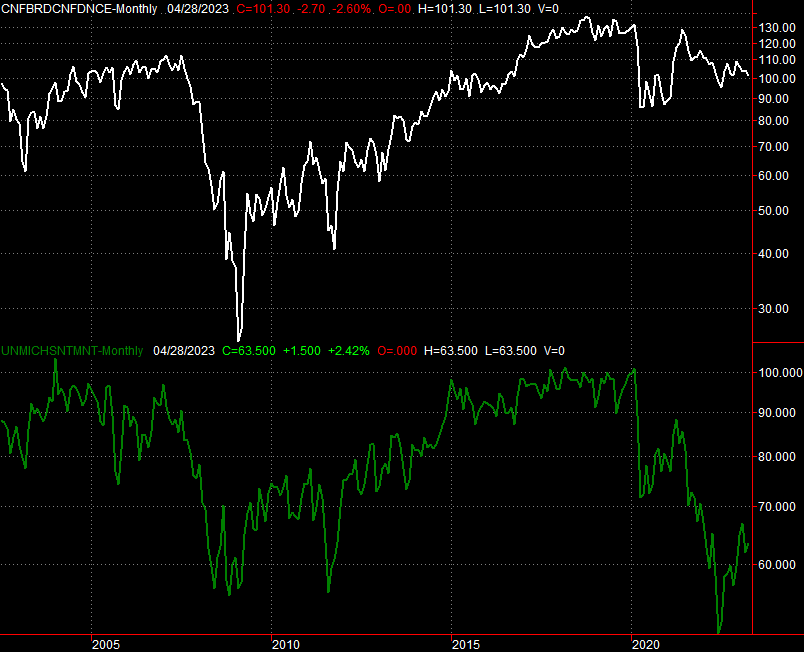
Source: University of Michigan, Conference Board, TradeStation
Other items with the potential to move the market this week are Wednesday's release of the most recent meeting of the Federal Reserve's governors, and -- possibly -- Thursday's reminder that the first quarter's GDP growth is pretty uninspiring at 1.1%.
Stock Market Index Analysis
We start this week's analysis out with a look at the daily chart of the S&P 500, since that's the view that says the most about the market right now. In short, the index finally broke through a major technical ceiling at 4175 (blue). It also pushed its way above a falling resistance line (red, dashed) that's been steering it lower since last August's high. Already above all of its key moving average lines, there's nothing left to stop it from continuing to rally now.
S&P 500 Daily Chart, with VIX and Volume
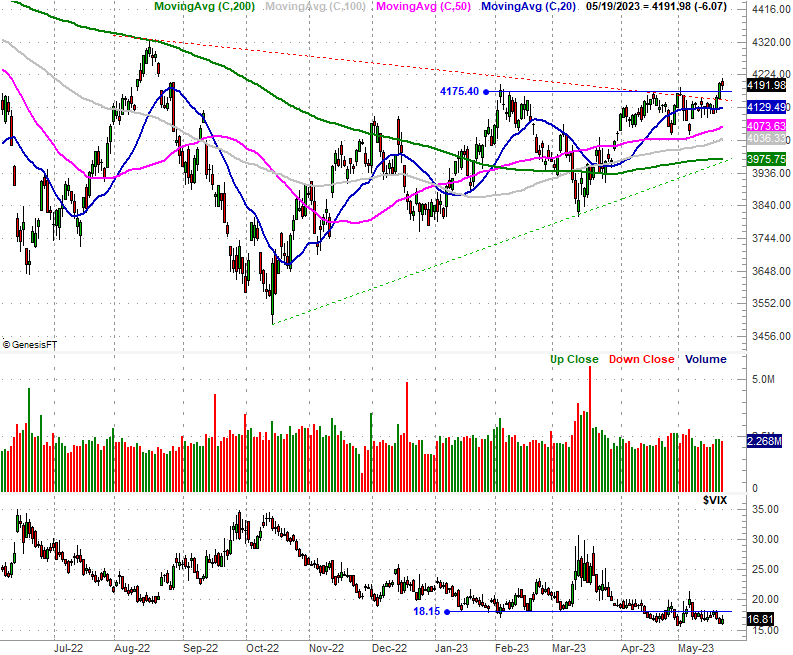
Source: TradeNavigator
Backing out to the weekly chart of the S&P 500 doesn't show us anything new, but it does put things in perspective. Namely, take notice of the fact that the index has already left behind a serious of higher lows. Now it just made its first major higher high. The tide isn't turning. The tide has turned.
S&P 500 Weekly Chart, with VIX and Volume
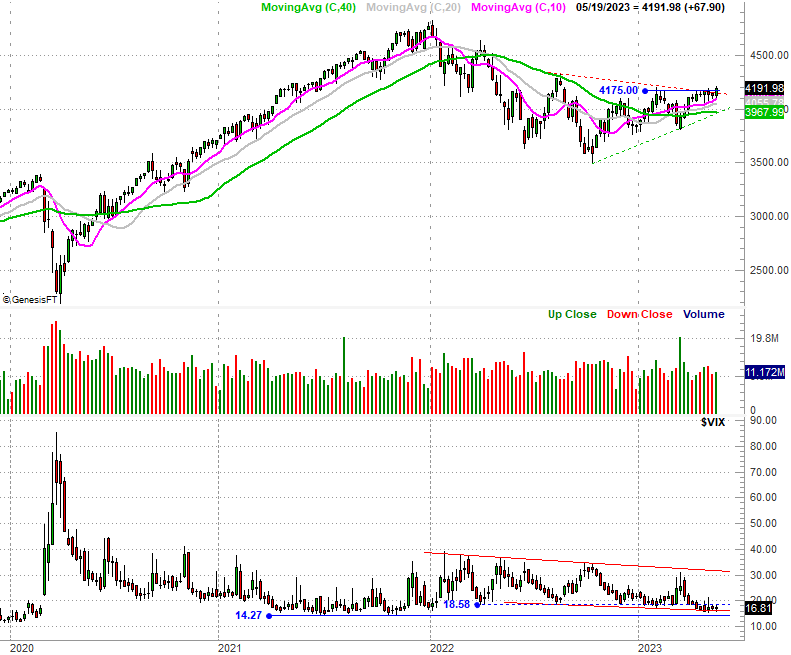
Source: TradeNavigator
The NASDAQ Composite beat the S&P 500 to this major technical milestone, which did so two weeks back and then put some distance between it and the ceiling at 12,226 last week.
NASDAQ Composite Daily Chart, with VXN
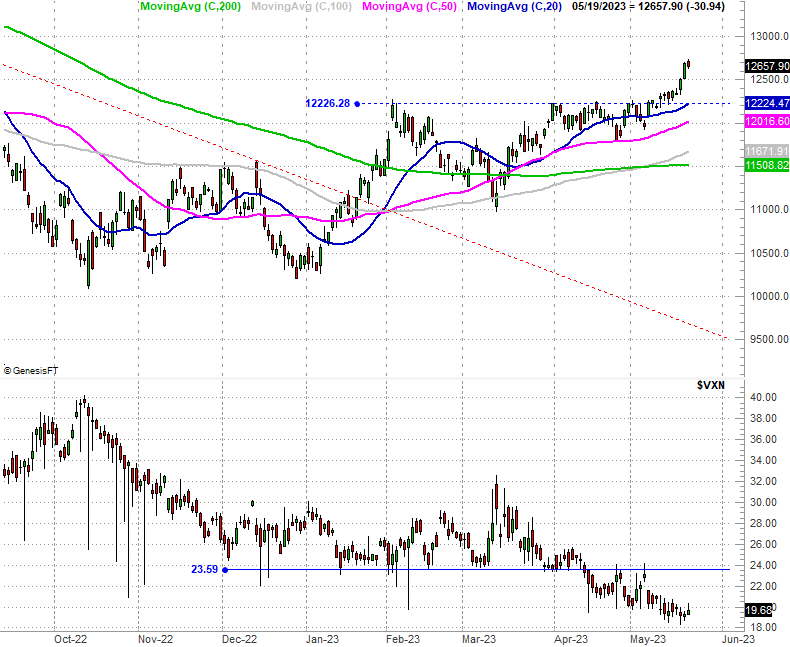
Source: TradeNavigator
And that distance could prove critically important.
Notice how on all the charts above (and most evident on the weekly chart of the S&P 500) that the volatility indexes are also at or near absolute lows. That makes it tough for stocks to keep rallying... not impossible, but tough. If the indexes can peel back a bit and let both volatility indexes move higher -- or at least push up and off their current lows -- that gives the rally some breathing room.
There's plenty of wiggle room for the indices too. The NASDAQ could easily fall back to the 12,226 level (where the 20-day moving average line currently lies) without the current rally even flinching, and could in theory slide all the way back to the 200-day moving average line (green) currently at 11,508 without breaking the broad uptrend. As for the S&P 500, it could fall all the way back to its 200-day line at 3975 and still not necessarily break the rebound that's been underway since October.
That being said, you probably CAN plan on a pullback sooner or later, and likely sooner THAN later.
The market's been jaggedly volatile of late, and with traders along with analysts all trying to rectify confusing economic headlines, stocks remain subject to above-average volatility. Although nearly two months of sideways movement suddenly being uncoiled usually sparks a sizeable surge, this bullish jolt won't necessarily be a long-lived one.
All the same, the bigger-picture momentum is now bullish. Trade accordingly until it's clear you can't.