Weekly Market Outlook – A Good Week, But Not a Perfect Ending

Stocks bounced back from the setback a week earlier. But, the advance was less than ideal. The S&P 500 slowed down late in the week when a well-established technical ceiling was tested again. That doesn’t mean the bigger-picture advance is done. In fact, the S&P 500 is trapped nicely between rising support and resistance lines. That’s bullish to be sure. The index is just bumping into the upper boundary of this range. That’s OK, as the index ended the week at a record high.
The NASDAQ Composite, on the other hand, is curiously struggling. While it made a gain last week too, it’s yet to hurdle the recent technical ceiling at 16,175, which also happens to be the peak from late-2021. There’s something about this level. It’s a bigger-picture problem simply because the NASDAQ tends to lead the broad market higher as well as lower. The fact that it’s still lagging in terms of leadership suggests the market isn’t quite as healthy as it seems with just a superficial look.
We’ll show in pictures in a moment. Let’s first run through last week’s most important economic numbers and preview what’s coming this week. Spoiler alert -- this week is loaded.
Economic Data Analysis
Only one item of interest during the holiday-shortened week… last month’s sales of existing homes. They were up, from December’s level of 3.9 million to 4.0 million. That’s a pretty solid improvement, but as the chart below suggests, sales are still rather low on an absolute basis.
New, Existing Home Sales Charts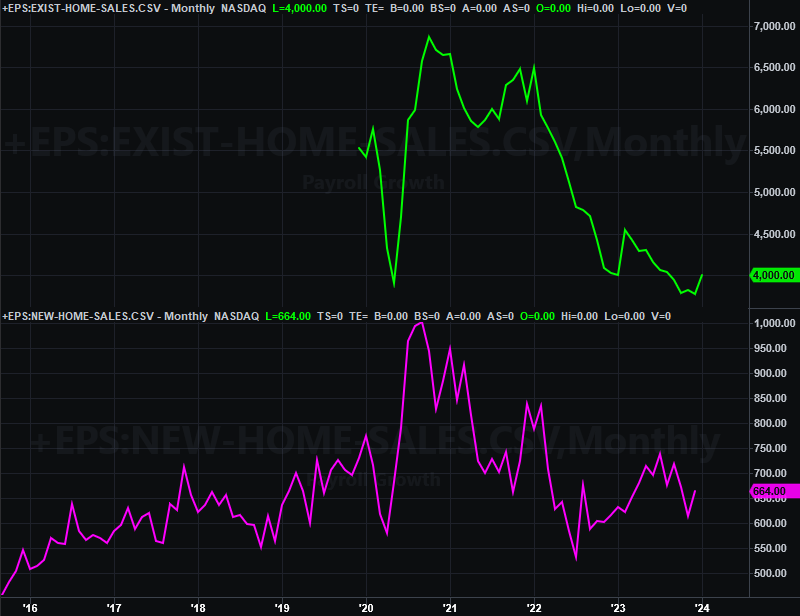
Source: National Association of Realtors, Census Bureau, TradeStation
Last month’s new home sales numbers January will be reported on Monday of this week. They’re expected to be up again, to 680,000. Again though, that’s still a relatively low figure bolstered by the fact that so few existing homes are being sold. Overall home sales remain abnormally low, with higher interest rates and still-high home prices stifling them.
Everything else is on the grid.
Economic Calendar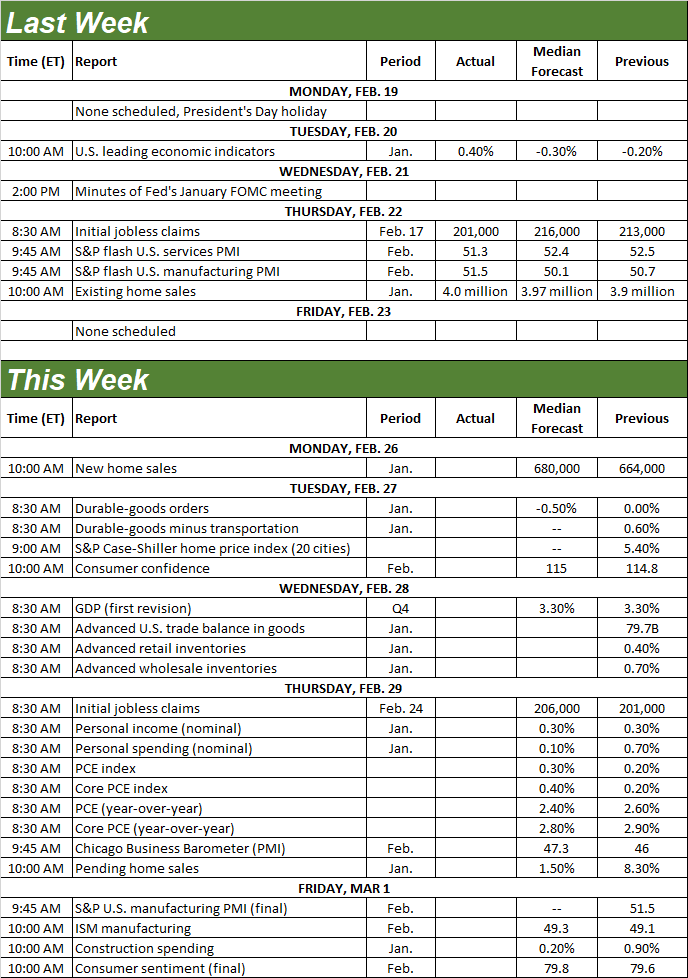
Source: Briefing.com
New home sales aren’t the only item on the economic dance card this week… even on the real estate front. On Tuesday we’ll hear December’s Case-Shiller Index of home prices along with the FHFA Home Price Index. As you can see, while still elevated, pricing pressure is finally starting to sink in. One could be fueling the other.
Home Price Charts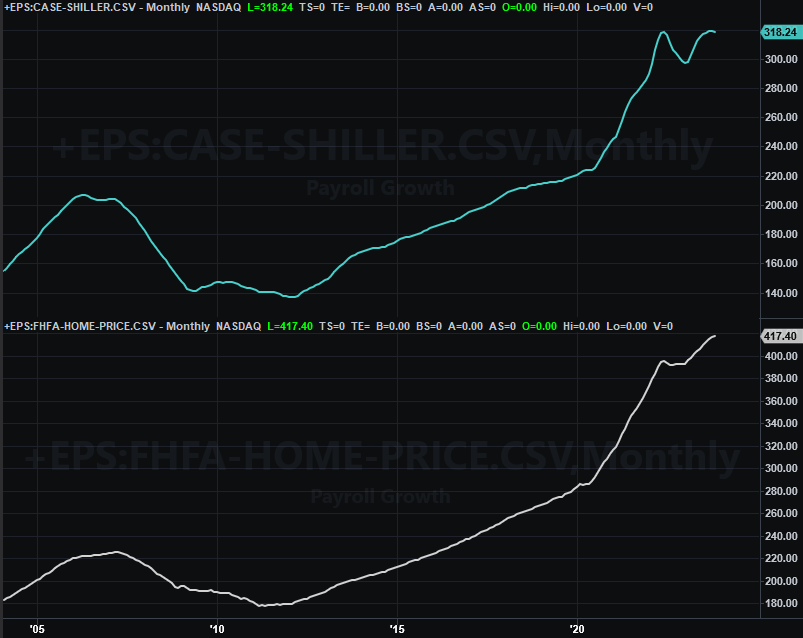
Source: Standard & Poor’s, FHFA, TradeStation
It’s also a big week for consumer sentiment. The Conference Board’s look at February’s consumer confidence is due on Tuesday, while the University of Michigan’s third and final look at consumer sentiment is coming on Friday. This has actually been a surprising bright spot of late, and economists believe both numbers will improve slightly for this month.
Consumer Sentiment Charts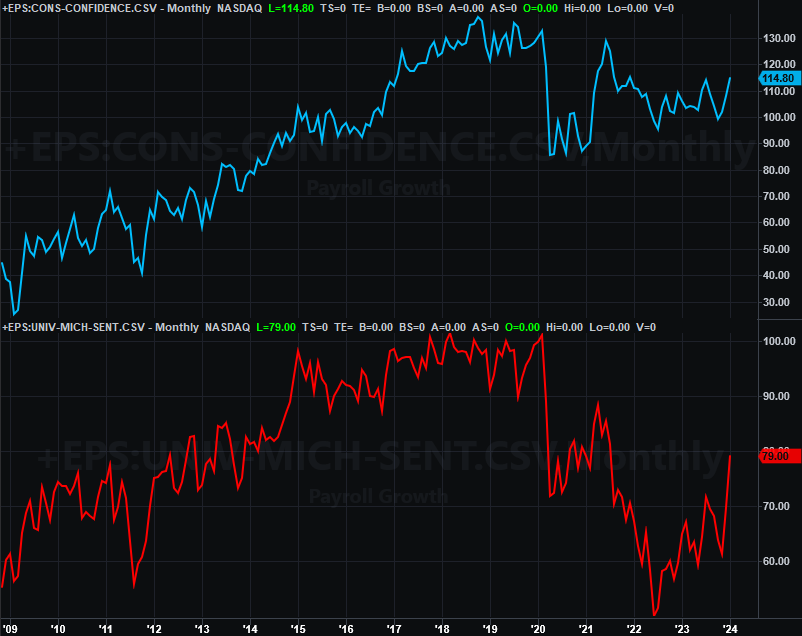
Source: University of Michigan, Conference Board, TradeStation
The Institute of Supply Management’s manufacturing report for February is coming on Friday. There’s no posted forecast yet, but do know we’re seeing a decent effort to turn things around from the year-ago lull.
ISM Services, Manufacturing Index Charts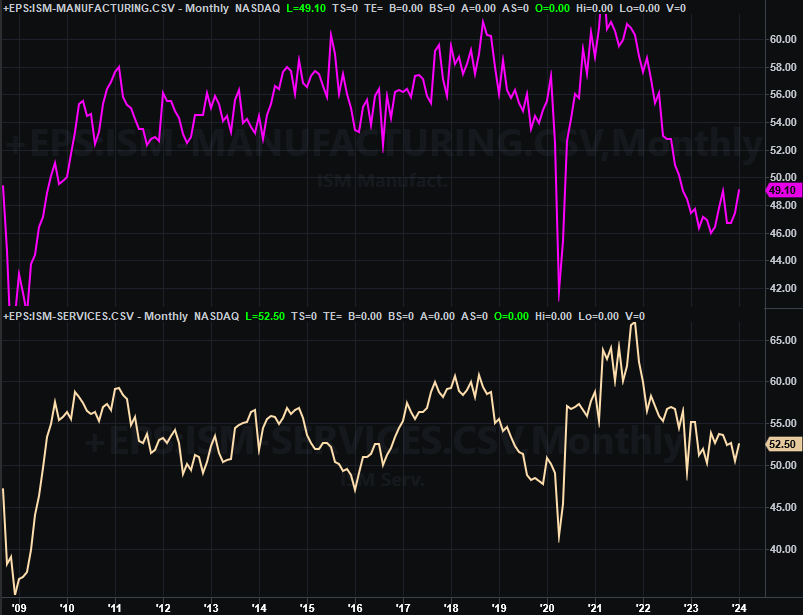
Source: Institute of Supply Management, TradeStation
The services index isn’t bouncing back quite as well, although it does appear to be falling at a less aggressive pace. This data will be updated next week.
Although we’re not charting either right now, there’s a couple of other reports coming this week you might want to keep your eye on. The fourth quarter’s preliminary GDP report will be posted on Wednesday, and February’s consumer income and consumer spending numbers will be reported on Thursday. Economists are calling for GDP growth of 3.3%, which is down from Q3’s pace, but still reasonably healthy. Income spending growth should be nominal, while spending growth should slow quite a bit from January’s clip. Both are worth watching, as these are the numbers the Federal Reserve considers when making decisions about interest rates.
Stock Market Index Analysis
It was a winning week in that stocks logged gains. The S&P 500 was up just under 2%, while the NASDAQ Composite logged a gain of 1.4%. The S&P 500 also reached record levels.
The NASDAQ Composite, though, is curiously lagging.
Take a look at the weekly chart of the composite below. Yes, it was up, reversing the prior week’s modest tumble. It stalled near the 16,100 mark though, as it has for the past three weeks. That’s interesting if only because that’s exactly where the NASDAQ peaked all the way back in late-2021.
NASDAQ Composite Weekly Chart, with VXN and Volume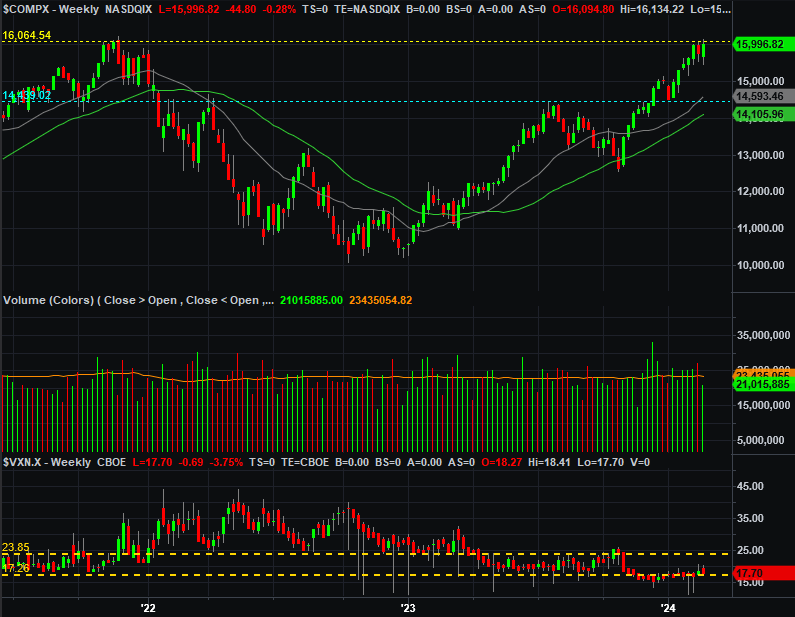
Source: TradeNavigator
Maybe it’s nothing. It’s something of a red flag worth keeping an eye one, however, if only because the NASDAQ is supposed to lead rather than leg. If it’s not making new highs, it’s a hint that traders are no longer making big bets on technology growth stocks like the so-called Magnificent 7, most of which are NASDAQ listings.
Here’s the daily chart of the NASDAQ Composite. From this vantage point things look better. Although choppy, the bigger trend is clearly bullish. Moreover, the index remains well above several different support levels (like its moving average lines).
NASDAQ Composite Daily Chart, with VXN and Volume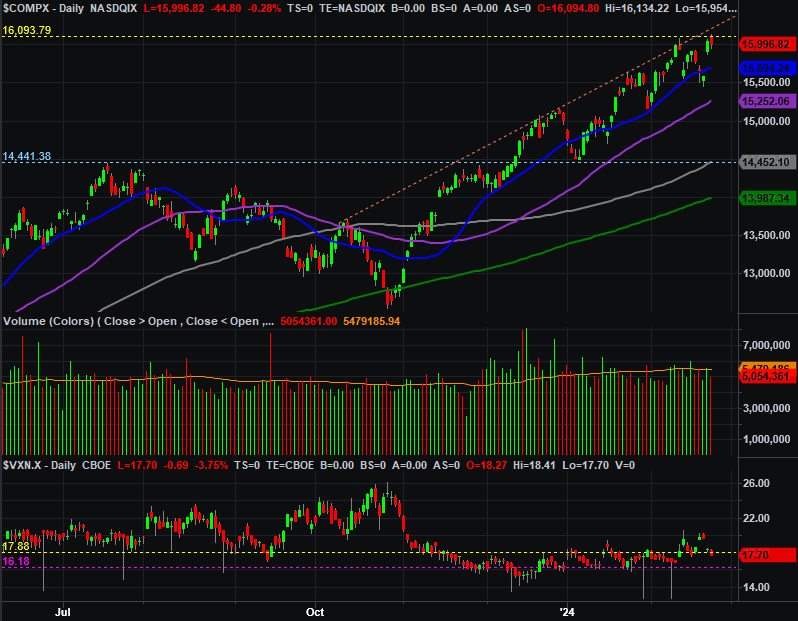
Source: TradeNavigator
Ditto for the S&P 500, which has another similarity with the NASDAQ Composite. That is, it’s being capped by a technical ceiling that connects all the key highs going back to the early October peak. The S&P 500 also seems to be finding good support at its 20-day moving average line (blue), pushing up and off of it last week to log its new high.
S&P 500 Daily Chart, with VIX and Volume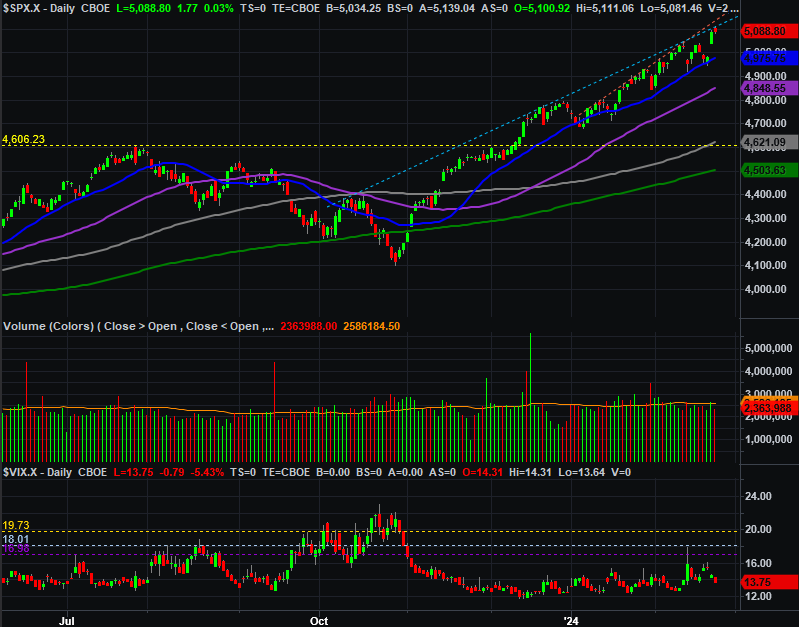
Source: TradeNavigator
Zooming out to the weekly chart of the S&P 500 puts things in a little more perspective. From here it looks like the rally’s going full steam ahead, following through and the cup and handle pattern completed in January, catapulting the index higher. As we noted a couple weeks back, this pattern could feasibly send the index all the way up to the 5,800 area before running out of steam.
S&P 500 Weekly Chart, with VIX and Volume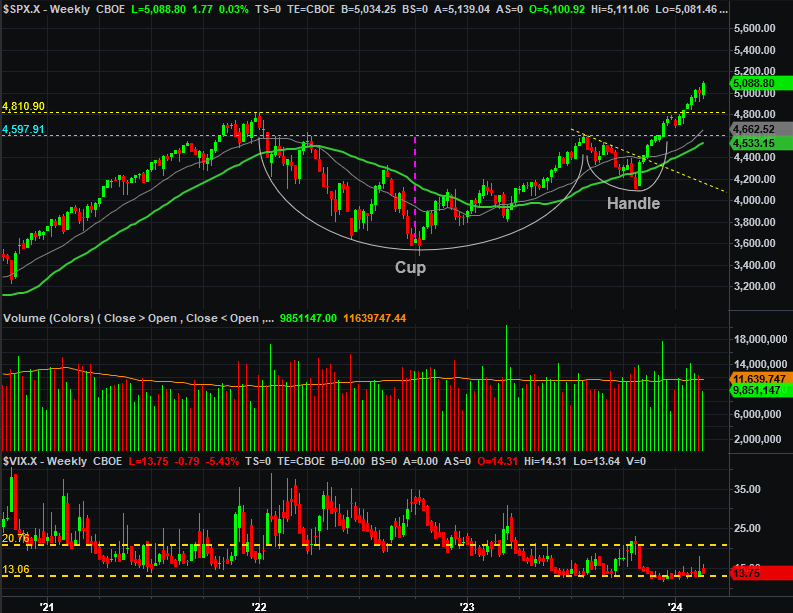
Source: TradeNavigator
Conclusion? The trend is bullish, so we have to be as well. We will be as long as the indexes remain above their 20-day moving average lines, or at least their 50-day lines (purple).
Even so, there’s no denying the risk of even a temporary pullback taking shape sooner than later. The S&P 500 is now up 24% from October’s low. That’s huge, but it sets the stage for profit-taking. Any profit-taking may even qualify as a full-blown correction (a 10% pullback from a peak). That doesn’t have to mark the beginning of a bear market though.
With all of that being said, besides a break under any of the short-term moving averages, the volatility indices -- the VIX and the VXN -- are arguably the key “tells” here. The NASDAQ’s VXN is starting to test multi-month highs, and the S&P 500’s VIX is starting to form a bullish channel as well. If these indexes start to break through their resistance, that’s a worry even if the S&P 500 or the NASDAQ Composite don’t also start showing corresponding breaks under the technical support of their short-term moving averages.