Tuesday's Bullish Bump Was a Good Start to a Rebound, But...
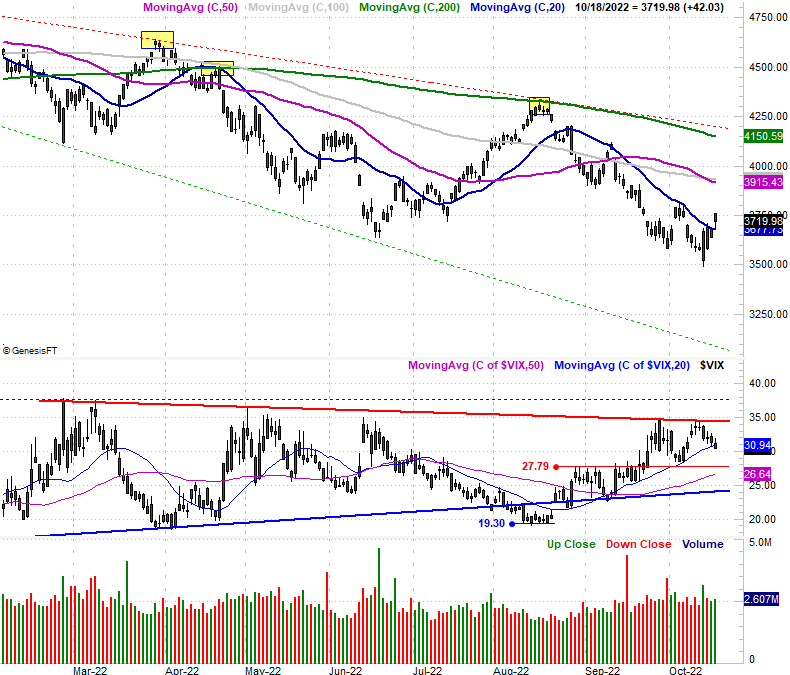
Not bad. Following through on Monday's gains, the S&P 500 rallied another 42 points (1.1%) on Tuesday to clear a key hurdle. That hurdle is the 20-day moving average line (blue) at 3677. The close was 3720. The S&P 500's Volatility Index (VIX) slipped under its 20-day moving average line too. It all suggests the tide and undertow have taken a turn for the better, even if just-barely. Take a look.
Except, don't be too quick to jump to a conclusion here.
It's become a tiresome story at this point, but it bears repeating now. This market is pretty schizophrenic, and more than capable of dishing out a headfake that causes people to zig just when they should be zagging. This is what we may be seeing take shape right now. We just don't know yet. When will we know? When the effort is truly tested, and the bulls pass the test. Specifically, let's wait and see how the buyers respond when the bears take a real swipe at them.
The line in the sand, of course, is still the 20-day moving average line.
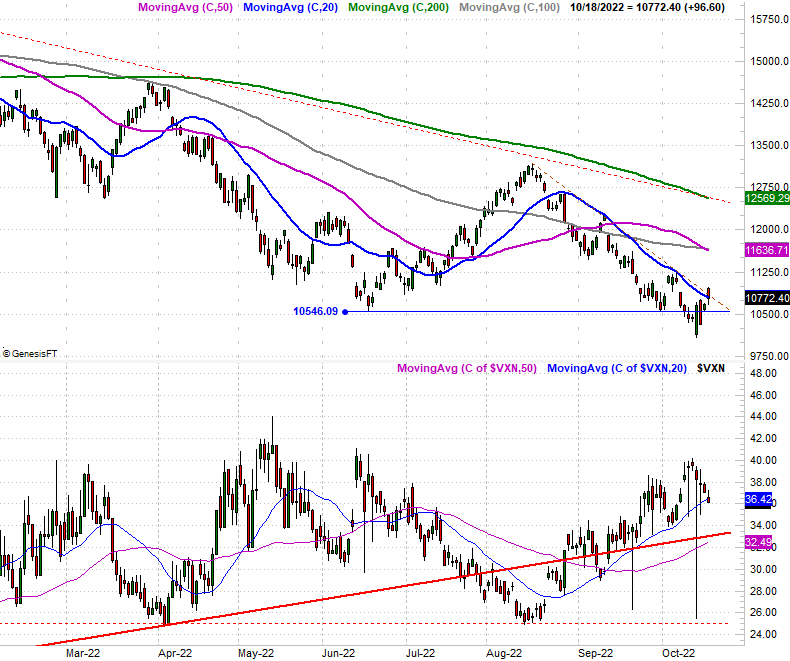
That's true for the NASDAQ Composite too, which looks pretty similar to the S&P 500. It too moved above its 20-day moving average line at 10,791 before sliding back to close right at that level. And, like the S&P 500's volatility index, the NASDAQ's Volatility Index (VXN) closed just a tad under its own 20-day moving average line on Tuesday.
As we mentioned in Sunday's Weekly Market Outlook, October is often a bear killer. The reversal of bear markets and the beginning of bull markets that take shape in October, however, typically do so in the middle of the month. The clock was ticking down on this time around, so it's encouraging to see it start taking shape.
The trouble is, the action thus far has hardly been convincing. As was noted above, none of Tuesday's action can be truly trusted until it's tested. And that's a problem in and of itself. The long the market goes without staging a recovery, the more difficult it becomes to inspire the confidence that a rebound effort needs to persist. If this weakness/selling drifts into November, investors may simply choose to remain on the sidelines until the new year, when there's more clarity regarding inflation, interest rates, and earnings.
The real "all clear" signal for the bulls? That's going to be the 50-day (purple) and 100-day (gray) moving average lines, which have just converged for both of the above indexes. It could be a while before that even has a chance of happening though, given the market's current mode of moving back-and-forth en route to... well, anywhere.
First things first though. Let's see what happens on Wednesday. It could make everything discussed above moot.