Traders Are Still at Both Ends of the Fear/Greed Spectrum, and That's a Problem
At first glance it looks like the rebound effort following last week's marketwide drubbing has already failed. The buying effort slowed to a crawl on Wednesday, and today's - Thursday's - trading is decidedly bearish. We're not yet back to last week's lows, but it appears we're pointed in that direction again.
Before jumping to any conclusions though, know that there are some things traders are either doing or not doing that they arguably should be doing. Investors aren't anywhere near as afraid as they should be... at least on some fronts.
On other fronts, they are.
It matters, if only because the fear-driven and greed-driven market may be dropping deceptive hints. Indeed, the overarching, aggregate hint may be one of net-nothingness. In other words, it's entirely possible the market is just going to drift sideways for a while, until traders figure out what's going on and then decide what's next.
Reality
In a perfect world, the market trend at any given time would make sense. Stocks would more or less reflect past and plausible results, with tiny adjustments being made every day as new information is processed.
We don't live - or trade - in that perfect world though. We trade in a world where hysteria and headlines push the market around. Sometimes, like now, that hysteria-driven dynamic can completely take charge and run roughshod over the bulls or the bears.
That's not entirely a bad thing for savvy traders that know how to spot reversals.... not that it's hard to do. Fear and greed tend to be at their most frenzied right around bottoms and tops, respectively. Find the tools that indicate fear and greed, and you've found a great way to get in and out of the market quite effectively.
Problem: Right now, all the different tools we'd normally use to measure fear and greed are telling us different stories. It's an indication that traders aren't really sure of what lies ahead, even if they're trading as if they do.
Let's run through our two primary fear and greed indicators, which frustratingly enough are sending us two different messages.
VIX
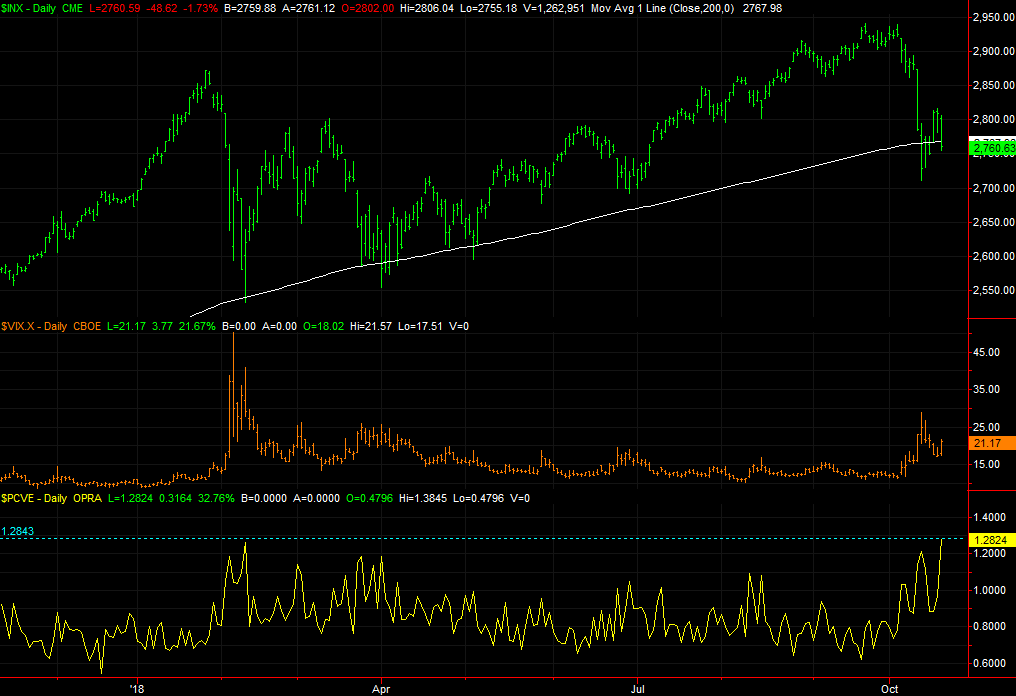
The CBOE Volatility Index (VIX) is, in simplest terms, a fear gauge. In fact, it's often referred to as the market's "fear gauge." When it's abnormally high, traders are terrified by virtue of the rising prices they're willing to pay for put options, and the price they're not willing to pay for call options. [The VIX is based on a basket of option prices.]
There comes a point when the VIX is so high, however, it can only mean that the sellers are all but exhausted as they've already done all the selling they're going to. And, any option traders have already bought all the put options they're going to. Note how the VIX surged in early February, right as the selling was coming to a close and a rebound was about to begin. Also notice that, despite a sizeable meltdown of late, the VIX has remained relatively tame. We may not have yet been through that "fear climax," meaning it still lies ahead.
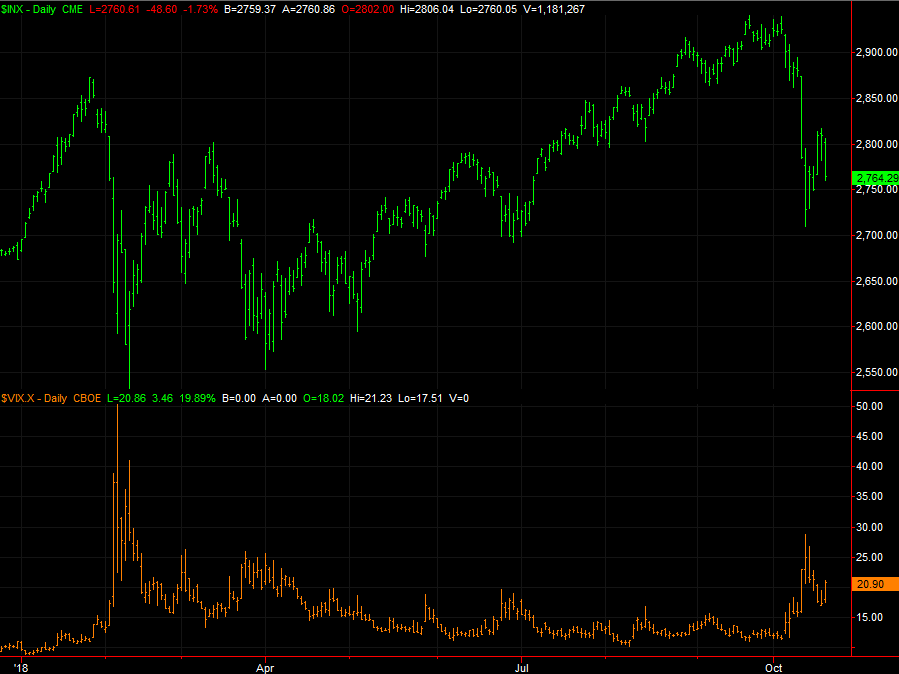
The VIX's (very) modest rise on Thursday is quite uncomfortable, given the scope of the selling.
Put/Call Ratio
It's interesting though. While the VIX may not be soaring, the put/call ratio is.
Just as the name suggests, the put/call ratio compares the number of put options that are trading hands on any given day to the number of calls being traded that same day. More puts means more bearish expectations, which means traders are selling. As was the case with the VIX though, when that put-buying reaches outrageous levels, all too often it means the bottom is near, if it's not already been made.
The market's put/call ratio reached a multi-month high of around 1.25 today, which is basically where it peaked in February, and where it peaked in August of last year not at a major bottom, but at least right in front of a tremendous rally.
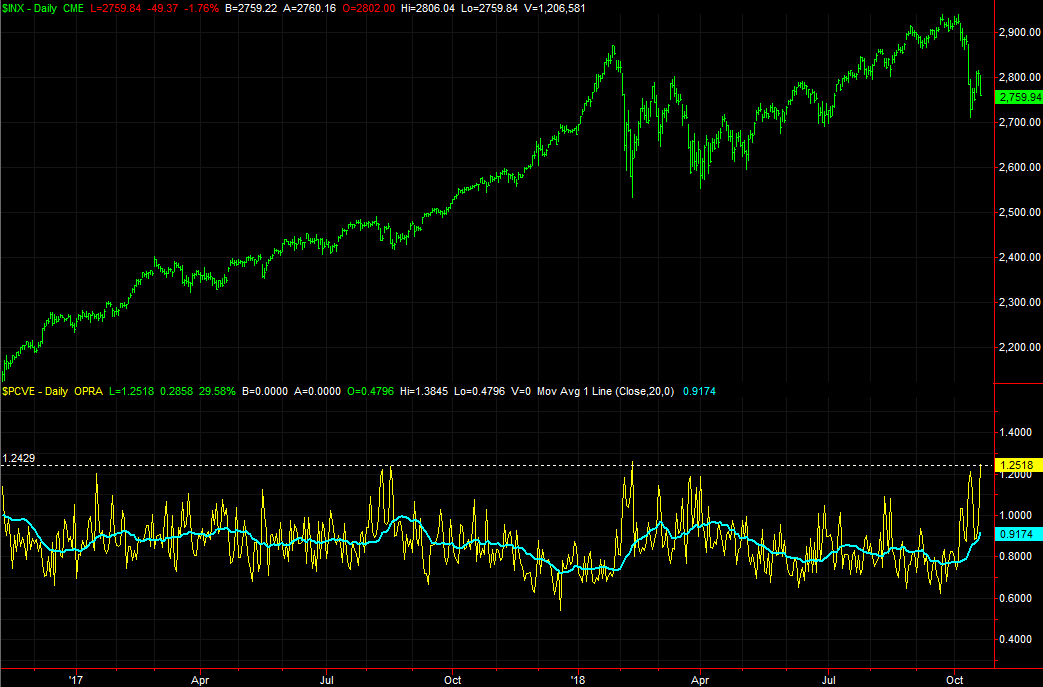
This reading of the put/call ratio suggests now's the time to buy.
Conclusions?
More often than not the VIX and the put/call ratio tell the same story, so this is an unusual situation that leaves investors unsure about what to make of the matter. Perhaps more important though, it's an indication that investors themselves aren't sure of what to do with the market right now. It looks good, and bad, and while the sellers kicked in again Thursday, the VIX says the sellers aren't entirely convinced the outlook is bleak... when they should be thinking it. They'll need to think it before a capitulation is made.
The put/call ratio says the capitulation may already be in the books.
Our take? We're leaning bearishly, based on the current trend.... and intuition.
Thanks to the severity of the selloff on Thursday, the S&P 500 is back under the 200-day moving average line. Although most investors and traders don't even realize it's happened, enough of the key market participants know it's just happened, and what it means. Even if it's just a self-fulfilling prophecy, that cross below the 200-day average line has (very) good odds of setting up another round of major selling.
That one, though, could be the last one that ultimately drives to market to a hard landing that serves as a bottom and buying point.
The bad news is, such a move could be excruciating as it's happening. The good news is, it shouldn't take too long for that to play out. You'll know that move is winding down when the VIX finally surges. The put/call ratio has already done it's thing.
Or, maybe the market's going to turn right around from Thursday's beat-down. That's kind of the problem with these mixed signals.