Thursday's Weakness Isn't Fatal (Yet), But One Red Flag Is Now Waving

It was anything but a winner, with stocks getting spooked by a confusing message about healthcare from President Biden, and of course, COVID-19. But, Thursday's selloff hardly damaged the market beyond report. There is one curious dent, however, that should be pointed out.
But, first things first. This is what the S&P 500 looks like as of Thursday's close. The index never really made a clean break above and beyond the upper boundary of its long-term converging wedge pattern (orange), and finally buckled under the weight of recent gains. Nevertheless, the index itself remains above its 20-day moving average line (blue), and well above a huge technical floor currently near 4427... where the 50-day moving average line (purple) has intercepted the lower boundary of S&P 500's converging wedge pattern. Also notice the VIX has yet to pop above any real technical ceilings even though it's inching upward now.

This action would imply that all remains well in the land of market-dom. And, perhaps it does. Not every major index is faring as well, however. The Dow Jones Industrial Average managed to break below its 50-day moving average line (purple) on Thursday, and in so doing has broken under the straight-line floor that's been guiding it higher since February by making sure it never falls below it. Take a look.

It would be easy to dismiss the technical stumble. We've spoken at length of late about how growth stocks are outpacing value stocks. The Dow's breakdown today aligns with that broad idea, in that the growth-heavy NASDAQ Composite looks to be holding up even better than the S&P 500 does.
Don't brush off the Dow's red flag too quickly though. While some indices tend to lead while others lag, they all still tend to move as a herd. More to the point, when the overall market is rising in good health, we typically wouldn't expect to see this degree of technical trouble. The odds part is simply that we'd expect to see the more aggressive, riskier growth names that make up the bulk of the NASDAQ Composite to show us the first breakdown if a bigger pullback was in the cards.
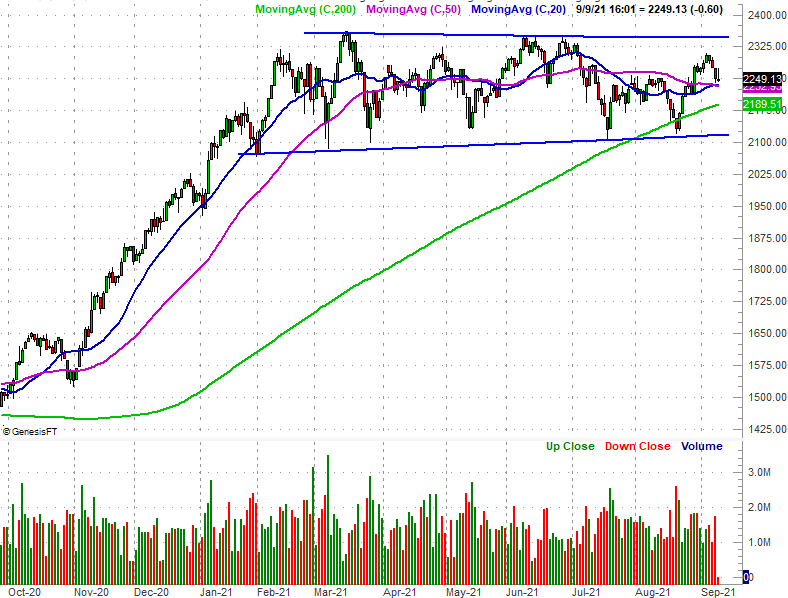
With all of that being said, there's still a third index chart we're keeping close tabs on here that we haven't bought up yet (at least not today)... the Russell 2000 Small Cap Index. It too is trapped in a narrowing trading range (framed by blue lines), and though it's in the middle of those confines right now and still above all of its key moving average lines, the lines in the sand here are about as clearly painted as they are for any index at this time. We can reasonably assume any marketwide red flags will show up on this chart as well. A break under the lower technical floor at 2116 would clearly be a problem.
Again, these aren't triggers or warnings. They're just developments worth keeping tabs on that could turn into sell triggers and pullback warnings.