Opinion: Watch this level on the S&P 500 to judge whether the bear market will end or accelerate
- S&P's four-year average can help assess the stock market's remaining downside risk -
By Simon Maierhofer, MarketWatch
Do you know what the 1987, 1990 and 2016 bear markets have in common?
The S&P 500 stopped and reversed at the four-year average.
Do you know what the 2001 and 2008 bear markets have in common? The S&P accelerated lower once the four-year average was breached.
Do you know where the December 2018 plunge stopped? At the four-year average.
What is the four-year average?
There are a number of simple ways to calculate and backtest the validity of the four-year average and how it can help assess remaining downside risk. The four-year average has either acted as support and stopped the losses, or acted as accelerant once support was broken.
Each year has on average 251.25 trading days, so a 1,005-day SMA (simple moving average) reflects the four-year average. Other options are:
- Four-year SMA (simple moving average) on the yearly chart
- 48-month SMA on monthly chart
- 208-week SMA on weekly chart
The monthly S&P 500 bar chart with the 48-month SMA provides a long-term perspective.
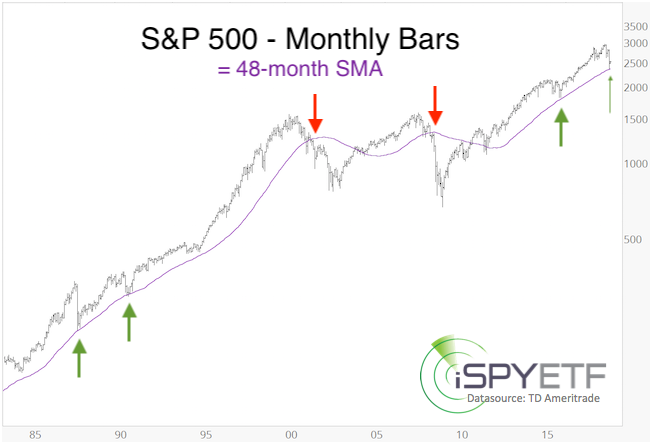
The green arrows mark the 1987, 1990 and 2016 lows while the red arrows highlight the 2001 and 2008 breaches.
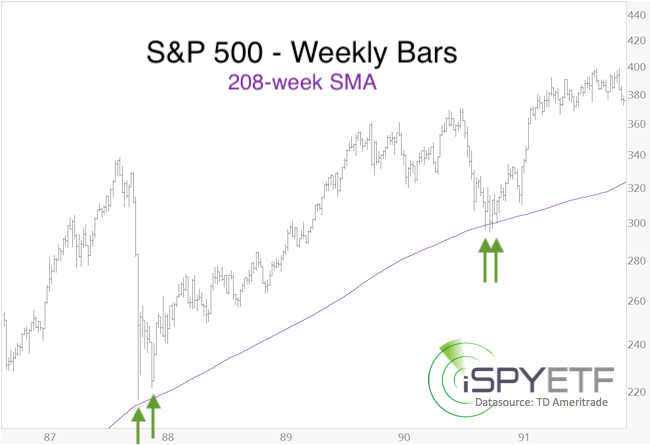
A closer look (weekly bar chart with 208-week SMA) at the 1987 and 1990 bear markets shows that the S&P challenged (or got close to) the 208-week SMA at least twice (green arrows).
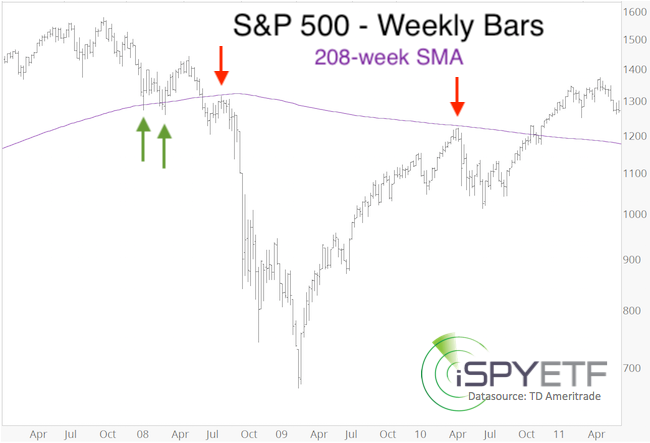
The S&P's interaction with the 208-week SMA in 2008-10 is even more interesting. The four-year average held as support more than twice (green bars), and acted as resistance twice. Failure to move back above the four-year average in August 2008 led to the biggest drop since the Great Depression.
Why is this important?
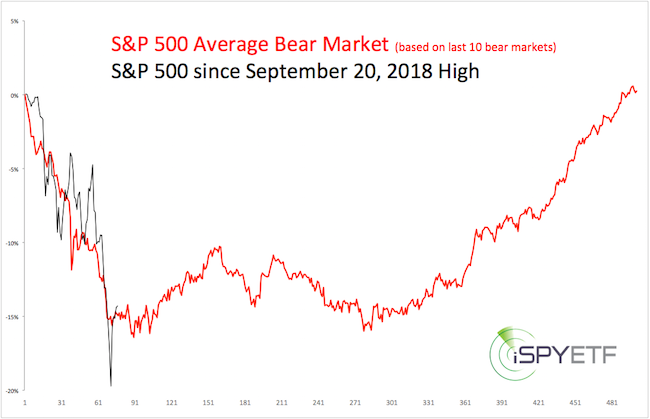
Since their last intraday record, the S&P 500 lost 20.2% to its recent intraday low, the Dow Jones Industrial Average 19.4%, the Nasdaq Composite 23.9% and the Russell 27.3%.
Much of the discussion is focused on whether stocks are in a bear market, rather than how much lower stocks will go.
The average bear market, based on the last 10 bear markets defined by Ned David Research, ended after a 16% loss. In simple terms, Ned Davis considers a bear market to have occurred after either a decline of more than 30% after 50 days or 13% after 145 days.
The S&P 500 has already lost as much as 20% (see chart).
The bear-market trap
Statistically, the average bear market stops right after, or just before it "officially" began.
Ironically, by the time most investors start protecting their portfolio against a bear market, the bear market is already or about to be over.
The four-year average can help investors assess the remaining downside risk. Currently the 1,005-day SMA for the S&P 500 is at 2,338, which is close to the 2,289-2,429 down side target I published in the Sept. 3 Profit Radar Report. There is good reason to believe that the S&P 500 will find support there once again.
I never rely on any one individual indicator, but the message of the four-year average harmonized with the common denominator of multiple indicators such as investor sentiment, breadth, momentum, technical analysis and Elliott Wave Theory: A drop to 2,300 +/- 50 points would likely spark a bounce.
The scope of the bounce along with three other characteristics of a buyable market bottom are discussed here.
Simon Maierhofer is the founder of iSPYETF and publisher of the Profit Radar Report.
From MarketWatch