Friday Is a Pivotal Day For the Market's Turnaround Effort
Is the bear market over? Not quite yet... technically. But, it could technically be over by Friday's close. There's a case to be made, in fact, that the bear market is already over. As usual, charts tell the story.
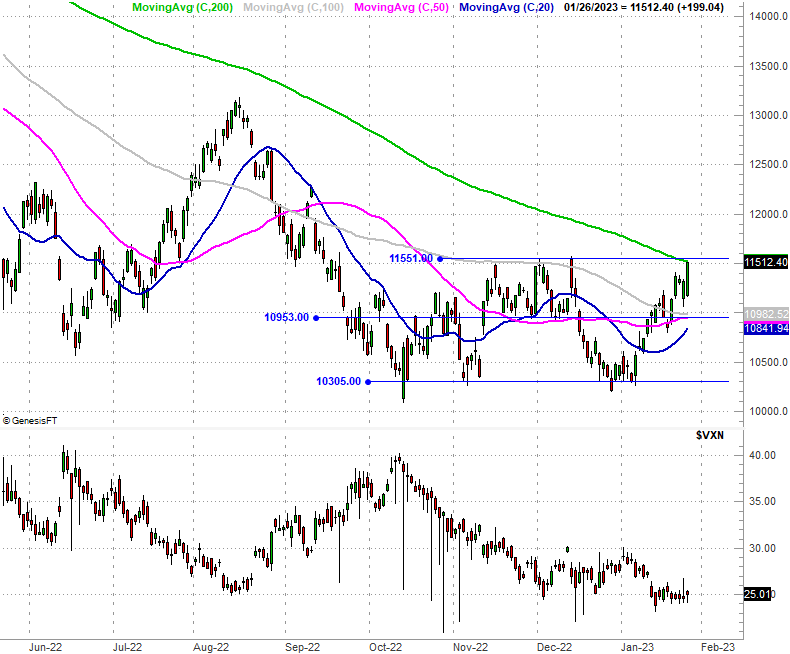
Friday could be the game-changer for fans and followers of the NASDAQ Composite as a market proxy. Thanks to Thursday's 1.76% rally, the index is testing its 200-day moving average line (green) as a ceiling for the first time since early 2020. It just so happens that this long-term moving average is also right in line with a horizontal ceiling at 11,551, which has been in play since November. If the composite can just tack on a few more points' worth of gain on Friday, that last little of technical progress could change everything for the better.
Just don't get too excited or be too quick to pile on if that's the way things take shape. The NASDAQ has rallied 12% just this month, which is a lot of gain to hold onto. Some traders may elect to lock in their profits if the composite makes any more progress on top of this, even if it clears the hurdle at 11,551. It's what happens after and because of that pullback we'll want to watch as a barometer of how things are truly shaping up here.
Given other clues, however, things may be even more bullish than they seem with just a quick glance as the chart of the NASDAQ Composite.
We're talking about the S&P 500... mostly. It had been guided lower by a falling resistance line going all the way back to the beginning of 2022 (red, dashed, on our weekly chart below). It finally started to push through that ceiling earlier this month, but as of this week it's well above that falling resistance line. And, that breakout takes shape following the first major higher low (see the rising, dashed blue line going back to October's bottom) since the latter part of 2021.
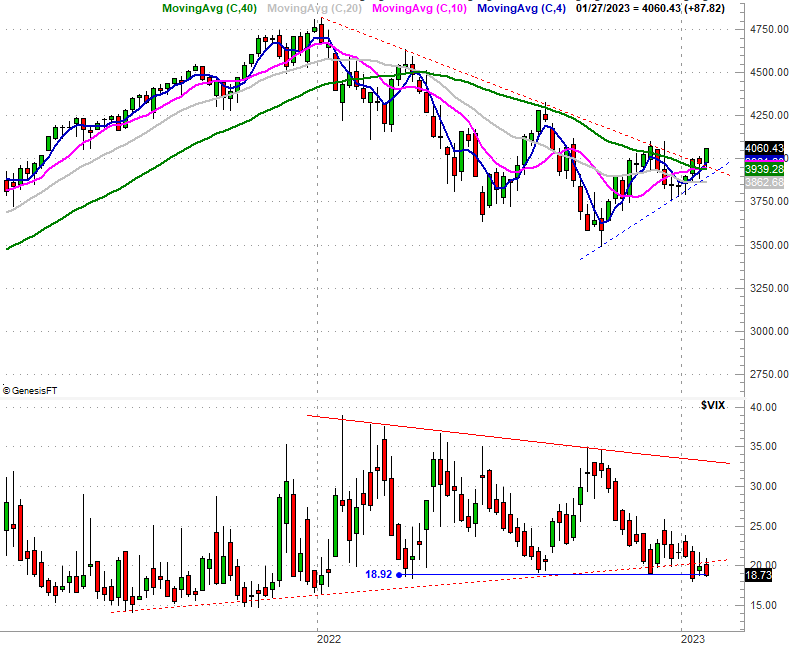
That's not the only bullish clue we're seeing from the S&P 500 though. Zooming into the daily chart of the index we can better see 50-day moving average line (purple) is close to hurdling the 200-day moving average line (green)... a so-called "golden cross" that's supposed to indicate a new, longer-term bullish trend is in place. If that happens, it will be the first time the 50-day line has been above the 200-day moving average line since early 2022, when it was falling.

We're also waiting to see if the S&P 500 breaks above December's horizontal high of 4096 (blue), but perhaps more than anything, we're waiting to see the S&P 500's Volatility Index (VIX) break below its technical floor at 19.0; it's also pulled under its slightly-rising floor (see the red, dashed lines on the weekly chart above).
The point is, there are a lot of bullish cues and clues within grasp. A bunch of them could materialize on Friday.
It's not the ideal bottom we would have liked to have seen made. We'd be much better served by a painful blowout marked by a spiking VIX and a high-volume rout of stocks to serve as a capitulation. We'd also rather see the bear market last a little bit longer, reaching the average 15-month mark sometime in March or April. That last little bit of prolonged weakness would inspire the sort of hopelessness that usually takes shape at a true bottom. What we're instead seeing is something of a meandering easing out of a bear market into a bull market... which works, but isn't exactly the most reliable beginning of a bull market.
As the old adage goes though, beggars can't be choosers. We'll see how things pan out on Friday. Look for an update of this discussion in this weekend's Weekly Market Outlook.