Kroger Stock Is at a Make-or-Break Point: Chart

- After a volatile session, Kroger stock is roughly flat on the day. Here's how to trade KR stock from here. -
By Bret Kenwell, TheStreet.com
Kroger (KR) stock is basically flat on the day, up about 40 basis points to $25.65 in midday trading Thursday.
Shares initially opened higher on the day, after the company reported better-than-expected second-quarter earnings before the open. While Kroger also beat on comp-store sales estimates, the company missed on revenue expectations.
However, it was comments on the conference call that took shares lower after that initially higher open, leaving Kroger stock mixed in the first few hours of the day.
Interestingly enough, it leaves the stock at a very notable point on the charts. Should it resolve higher, bulls may regain control of Kroger stock. If resistance holds it in check, though, bears may have their way with this one for the time being.
Let's look at the charts.
Trading Kroger Stock
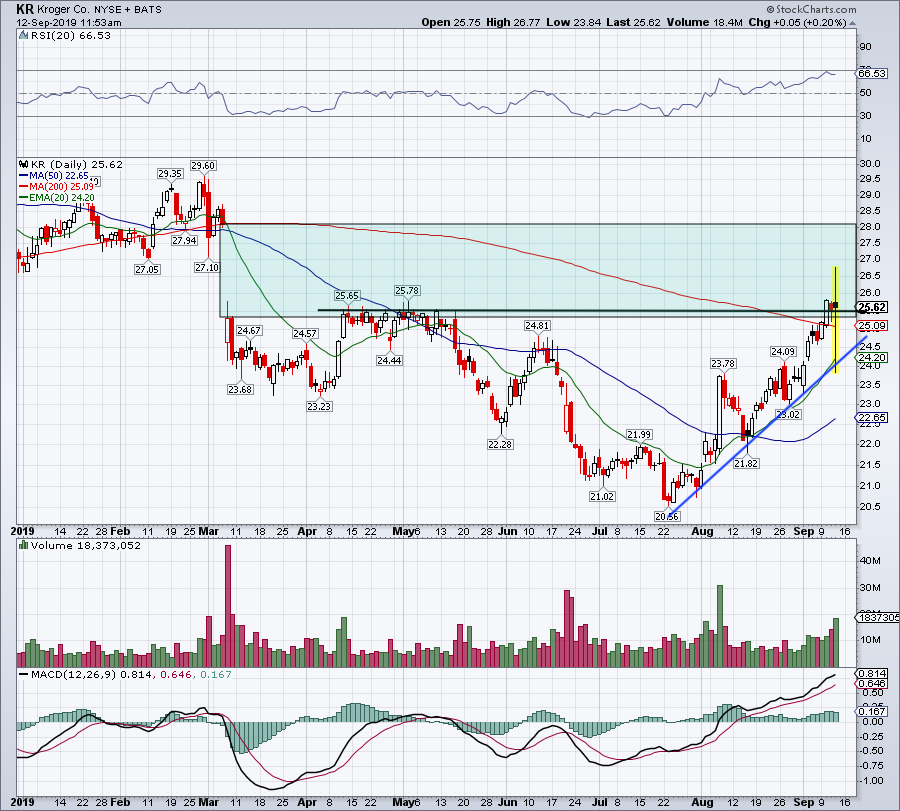
Daily chart of Kroger stock.
Kroger has not been one of the anointed retailers -- like Costco (COST) , Target (TGT) , Home Depot (HD) or a few others. Instead, Kroger has struggled as investors worry about growth, margins and competition.
Above is a daily chart of Kroger stock, while below is a longer term weekly chart. Both highlight some key levels.
For instance, the daily chart shows that Kroger's morning decline was met by buyers when shares bounced hard off the 20-day moving average and uptrend support (blue line). The stock then reclaimed the 200-day moving average, and is holding up above prior resistance between $25 to $25.50.
If Kroger stock can maintain above this former resistance zone, perhaps it can work its way higher in the coming days and weeks. In that event, look to see if KR stock takes out its post-earnings high -- currently at $26.77 -- and if it does, see if it can fill the gap up toward $28.
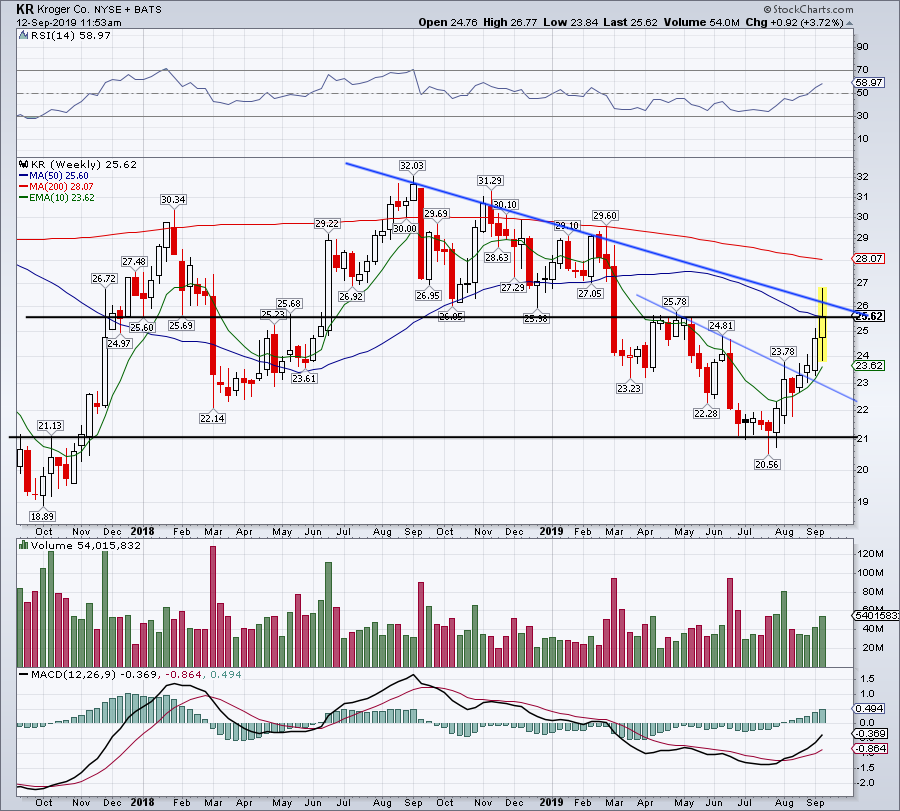
Weekly chart of Kroger stock.
On the weekly chart, we can see that there are more overhead obstacles to consider.
$25.50 resistance is easily noted, but traders have to be aware of the declining 50-week moving average at $25.60 and downtrend resistance (blue line), which is in play near $26. These marks do not guarantee that Kroger stock will fail here and head lower. However, they are something to be aware of for those that may be buying based solely on the daily chart.
Should KR stock resolve higher on the weekly chart, note that the 200-week moving average is up just over $28 -- the same level that would fill the gap on the daily chart.
Between the two, it's not hard to see why Kroger stock is at a make-or-break area. Over resistance and $28 is possible. Below $25 and the 20-day is the next level of support.
This article is commentary by an independent contributor. At the time of publication, the author had no positions in the stocks mentioned.