Global Stock Markets. Examined By Market Cap
Which Countries Control the Global Stock Market?
Below is an updated look at the current makeup of the global stock market by country. Using Bloomberg data, we've constructed a table showing the percentage of global market cap that each country (the largest 25) currently makes up. We also show where the percentages stood at the end of 2014, five years ago, and ten years ago.
World Stock Market Cap by Country Table
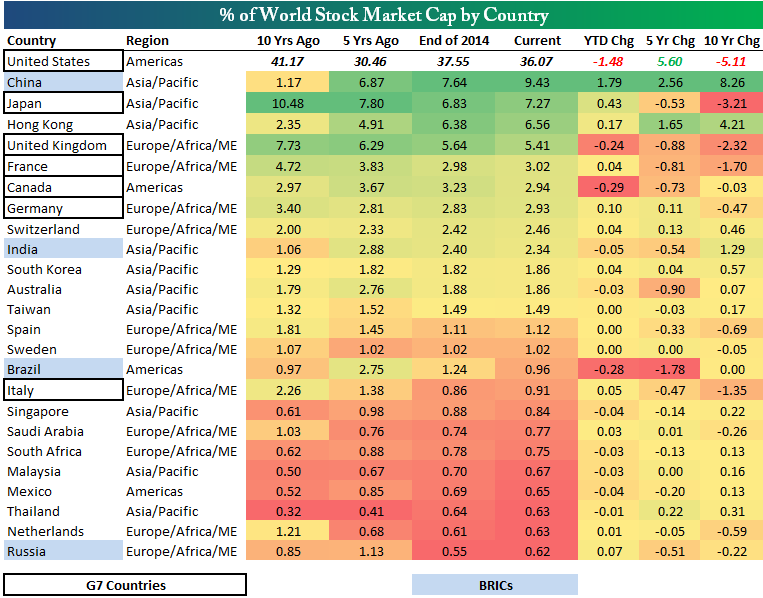
In analyzing the table, you'll see that the US stock market makes up 36% of world market cap. This is down 1.48 percentage points since the start of the year, up 5.6 percentage points over the last five years, and down 5.11 percentage points over the last ten years.
The reason for today's update was basically to highlight the surge that China has seen recently. Since the start of the year, China's stock market has seen its share of global market cap increase 1.79 percentage points from 7.64% up to 9.43%. A little farther and China will reach double-digit territory, which hasn't been seen for another country besides the US since Japan ten years ago.
Amazingly, ten years ago, China made up just 1.17% of global market cap, so it has seen its share increase nearly 10-fold since 2005.
As China has gained, Japan has lost share. While Japan still has the third largest stock market in the world, it has lost 3.21 percentage points over the last ten years.
Hong Kong has gained the second most in global share over the last ten years at 4.21 percentage points. Behind the US, it's three Asia/Pacific markets that are now the biggest. Developed Europe doesn't start showing up until you reach the UK in the fifth spot with a 5.41% share. Pretty much across the board, Europe has lost share of the global market over the last ten years.
Another country that we wanted to single out in this post is Brazil. Brazil was one of the hottest emerging markets during the 2003-2007 global bull market, but the country has collapsed since then and now makes up less than 1% of the global stock market.
Below we provide historical charts of world market cap share for ten key countries. For each country, the red line represents its average share going back to 2003. This allows you to see where countries currently stand relative to their long-term averages.
Global Stock Market Cap Charts
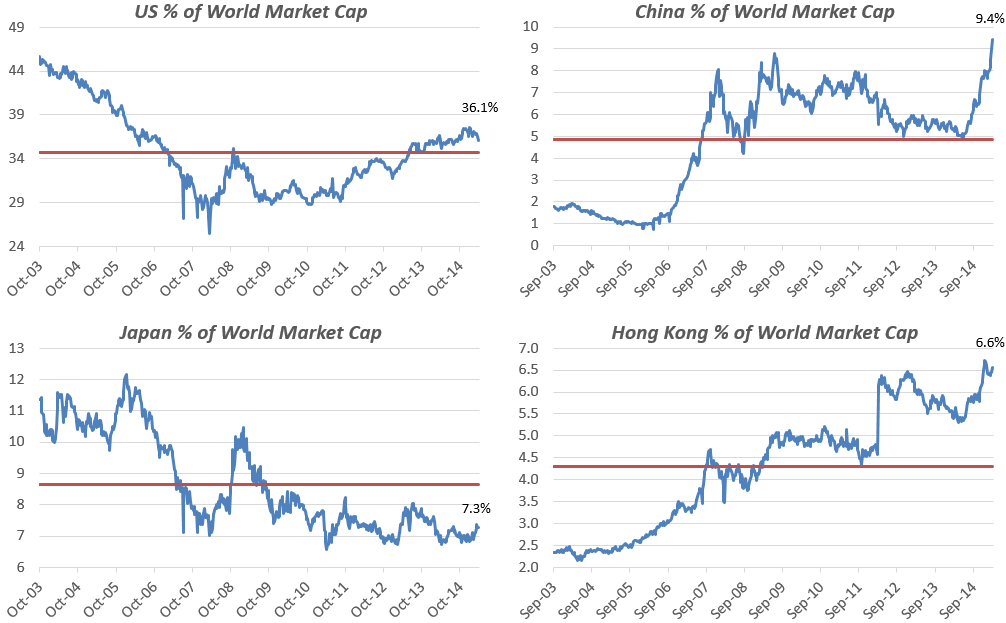
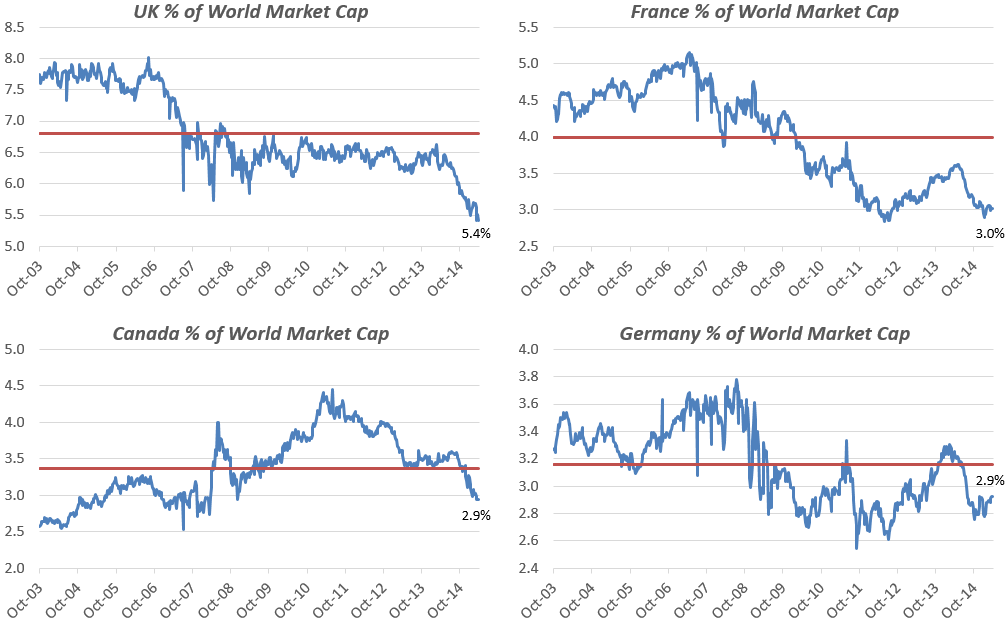
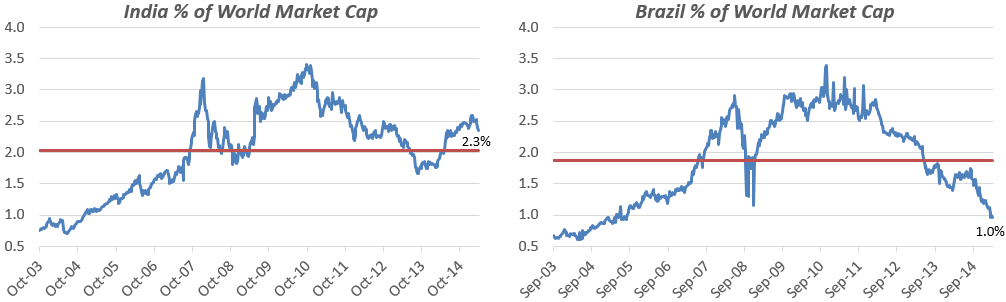
Look at China's massive surge to new highs recently as countries like the UK, Japan, Canada, France and Brazil lose out. Hong Kong has also seen a steady increase in share over the last ten years.
Courtesy of BespokeInvest.com