Wednesday's steep selloff was contained on Friday, even if not unwound. The market stopped the bleeding, and that was enough for the time being.
Traders aren't going to sit on the fence for very long though, if they do so any longer at all. For better or worse, the bulls and/or the bears are going to have to show their cards on Friday. The traders on the opposing sides of the table are likely to make sure of it. Charts are lending themselves to this pivotal standoff.
Take a look at the daily chart of the S&P 500 to get a feel for this premise. Wednesday's big bearish gap dragged the index under the 100-day moving average line (gray). Despite Thursday's brief move back above it, the S&P 500 was ultimately capped below this long-term line when the closing bell rang. That inability to turn things around for the better quickly is a concern.
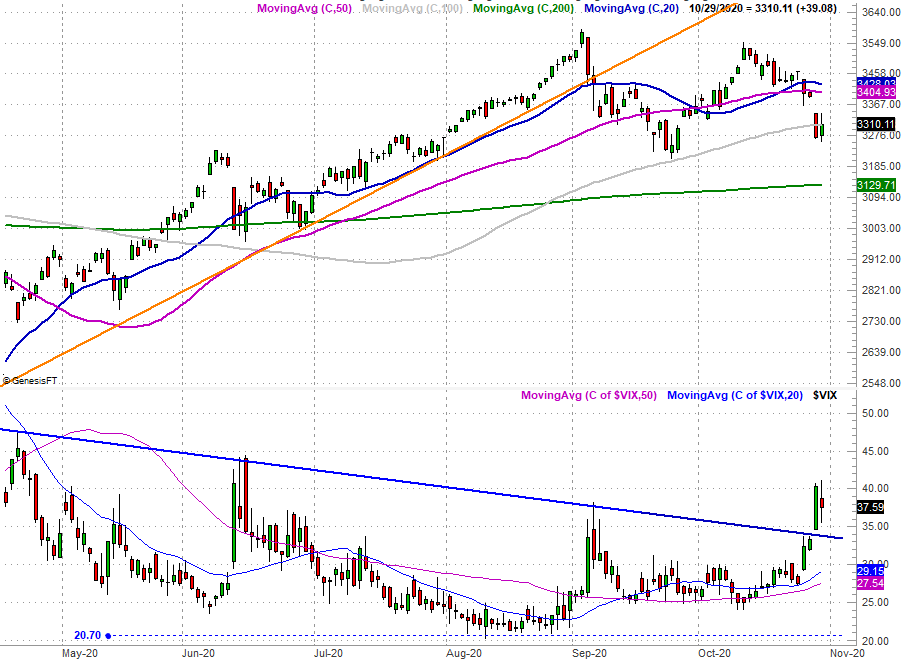
The VIX underscores this idea. On Wednesday it finally popped above a falling resistance line (blue) that had been steering it lower for weeks. This indicates a sizeable change of heart for traders. Namely, it suggests traders are suddenly doing a lot more hedging against a pullback, which in turn means they're subconsciously planning on a selloff... making one happen.
Clearly working in favor of the bulls is Wednesday's gap, now aching to be filled in.
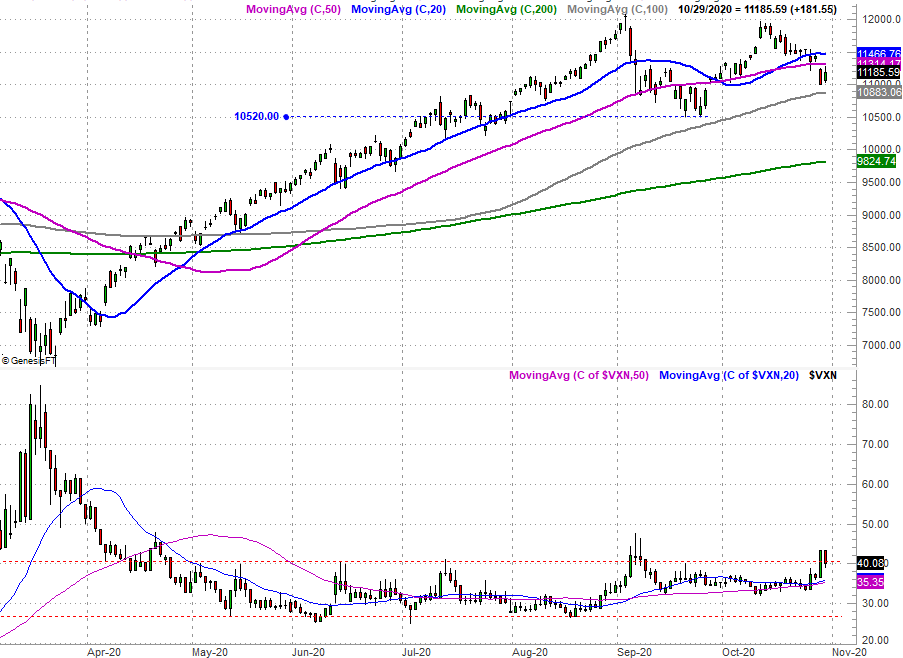
The NASDAQ Composite's chart is in the same basic condition. That is, it's broken below some key technical support levels in the form of moving average lines. It's not under the 100-day line (gray), but it is under the 50-day moving average line (purple). Thursday's rally effort didn't even threaten to break back above that line, in fact.
The real part of the NASDAQ's chart to watch, however, isn't the NASDAQ itself. It's the volatility index, or VXN. Like its S&P 500 counterpart, it's testing new ground. The ceiling at 40.8 (red, dashed) was breached on Wednesday, and the VXN more or less held there on Thursday. It's not shifted its entire range above the previous range of 25 to 40, but standing back, it looks like that's trying to happen. In the same vein, an objective look as the daily chart of the NASDAQ Composite indicates it's been losing steam since September.... right around the time the VXN started to test the waters of higher highs.
Bottom line? The indices are either on the fence, or trapped in a narrow range - the NASDAQ's 100-day line at 10,883 is just below where it is now, and could be tested soon. The VXN's and VIX's lines in the sand are also clear. They're all within one day's reach, but more than that, there's not a lot of room to maneuver here. That means this is all going to happen soon. Maybe it all firms up on Friday, though at this point traders may be ready to hang on the sidelines until after Tuesday's voting is done.
Just keep an eye on all the aforementioned lines and levels. Something has to give soon.