Finding Buy & Sell Triggers With MACD Technical Analysis Chart Indicator
Moving Average Convergence Divergence (MACD)
The moving average convergence divergence (MACD) indicator is considered by some traders to be the ideal trend-spotting tool.
As the name suggests, the moving average convergence divergence tool is a comparison of the relationship between two moving average lines of a stock, index, or other trading instrument. Specifically, the first line of the two-line indicator is the difference between the values of two moving averages, and is considered the 'MACD' line. The second line of the two-line indicator is a moving average of the MACD line (and as such, trails the first). Crosses of the MACD line above or below the trailing moving average of the MACD line are often seen as buy and sell signals. Both lines are centered on a zero line, and will travel above and below that level depending on the strength and length of a trend.
Most technical analysis software adds a third component to the MACD indicator... a histogram that extends above and below the zero line. This isn't information that isn't already evident between the plotted MACD line and the moving average of the MACD line - it's just the difference between those two lines represented in a different manner. Specifically, it's the difference between those two lines, with bar of the histogram starting at the horizontal level. This histogram can make it visually easier to spot trends.
An example of the moving average convergence divergence indicator will clarify how MACD lines work, and can be used.
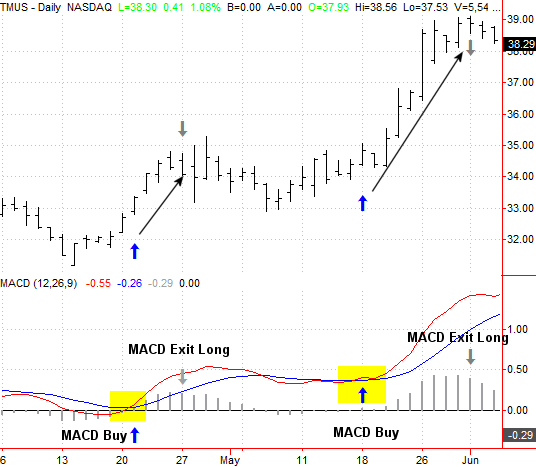
On the chart below, there are two distinct buy signals driven by bullish crosses of the MACD line above the moving average of that MACD line. In both cases, the signal was trade-worthy (particularly the second one). Also in both cases, once the divergence started to shrink - and become a convergence again - marked by a falling histogram, that would have been an ideal time to close out the bullish trade as weakness was around the corner.
TMUS Daily Chart
It's also worth noting that a MACD and MACD-moving-average line that are above zero are broadly bullish in themselves, suggesting the longer-term trend is a positive. In that light, bullish MACD crosses that materialize above the zero level are particularly bullish.
The moving average convergence divergence indicator works just as well for bearish trades, as the chart below suggests.
OLED Daily Chart
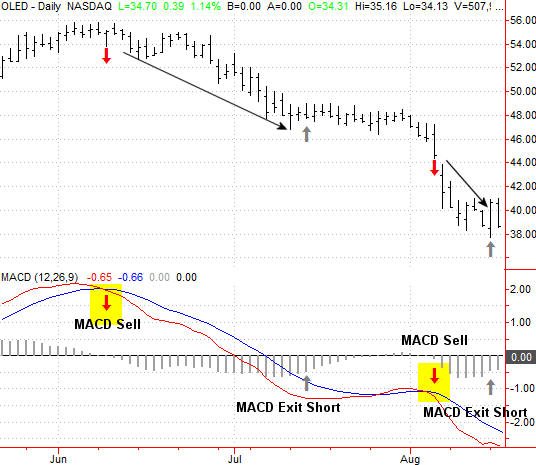
Again, the downtrend started to slow down when the bearish histogram bars began to shorted shrink in height... when the divergence turned into a divergence. Again, the new bearish/sell signals that occur below the zero line tend to be especially good signals, as they materialize when the long-term trend as well as the short-term trend are both lined up in a bearish direction.
In the examples above a convergence was used as a signal to close out a trade, though that's certainly not the only tool that could be used to signal the end of a momentum trade initiated by MACD lines.
The length of moving averages used to plot the lines of the MACD indicator can be varied as needed, though the most commonly accepted starting points are MACD lines that plot the difference between the 12-bar and 26-bar moving averages, with the signal line (or moving average of the MACD line) being a 9-bar moving average.
Assuming these standard settings are used, the formulas for the lines used in the MACD indicator are as follows:
- MACD Line: (12-day moving average - 26-day moving average)
- Signal Line: 9-day moving average of MACD Line
- MACD Histogram: MACD Line - Signal Line