FANG Stocks Update - Some of Them Are Healthier Than Others
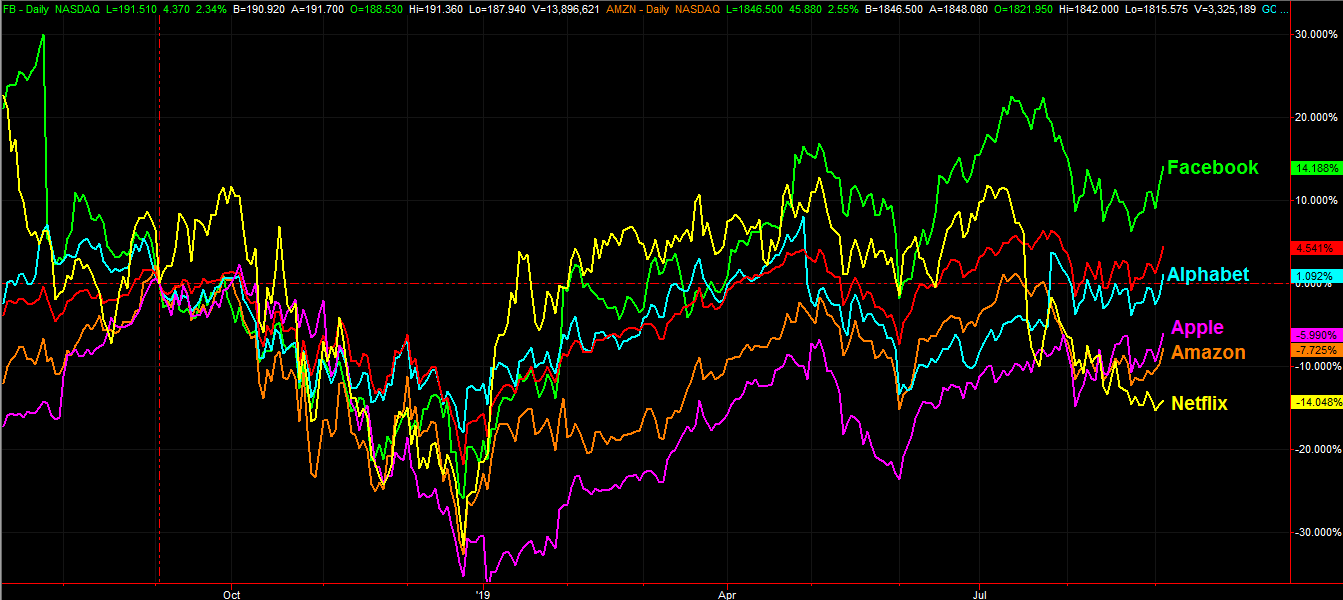
Not surprisingly, this week's marketwide strength has led, and been led by, most of the so-called FANG stocks. A couple of them look like they're setting up for more growth too. As was the case with the last update, however, one of these names looks like it's in real trouble. Though it was up on Thursday, this one-market-leader continues to lag the broad market.
That laggard is of course Netflix (NFLX). After being trounced in July in response to a disappointing earnings report -- disappointing subscriber growth, to be specific -- traders have been mostly unwilling to give in the benefit of the doubt.
The other interesting tidbit that doesn't necessarily show up on the performance comparison chart: No one FANG stock has retained a decisive leadership position. They've all led and lagged the NASDAQ 100 Index over the course of the past year; the NASDAQ 100 is plotted in red.
That's not the most interesting thing going on with the FANG names right now, however.
Take a look at Facebook (FB) and Amazon (AMZN) on the image below; they're the two bar charts at the very top of the graphic, in green then orange. Both have recently pushed up and off of well-established support lines that have been mostly made by the same ebbs and flows. In both cases, neither stock is yet to even come close to re-meeting their July peaks, and in both cases the basic trend lines suggest higher highs are ultimately in order.
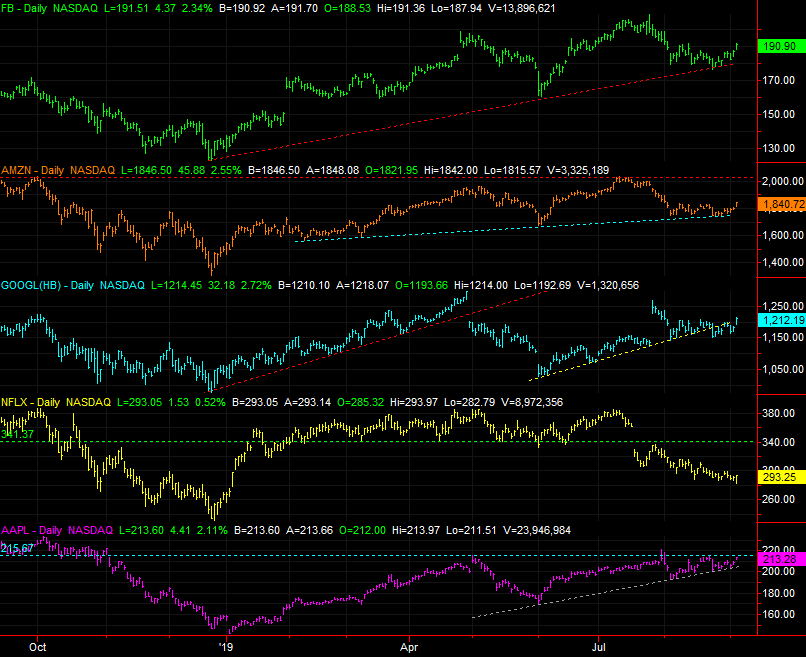
It's the structure and organization of these two charts that ups the odds -- significantly -- of the recent bullish reversal continuing to get traction.
For what it's worth, Apple (AAPL) shares plotted in purple on the bottom of the graphic are also knocking on the door of a big break above horizontal resistance around $216, and they're doing so with the benefit of pushing up and off support that mostly mirrors the support lines Amazon and Facebook are enjoying. That setup/shape is catalytic as well.
As for Alphabet (GOOGL), good luck handicapping it right now. The trend seems bullish, but it's all over the map right now.
The focus name for today, however, is Amazon. The recent rebound at an established support level is much more than just a push off of straight-line support. It also took shape at the pivotal 200-day moving average line, marked in red on the daily chart below.
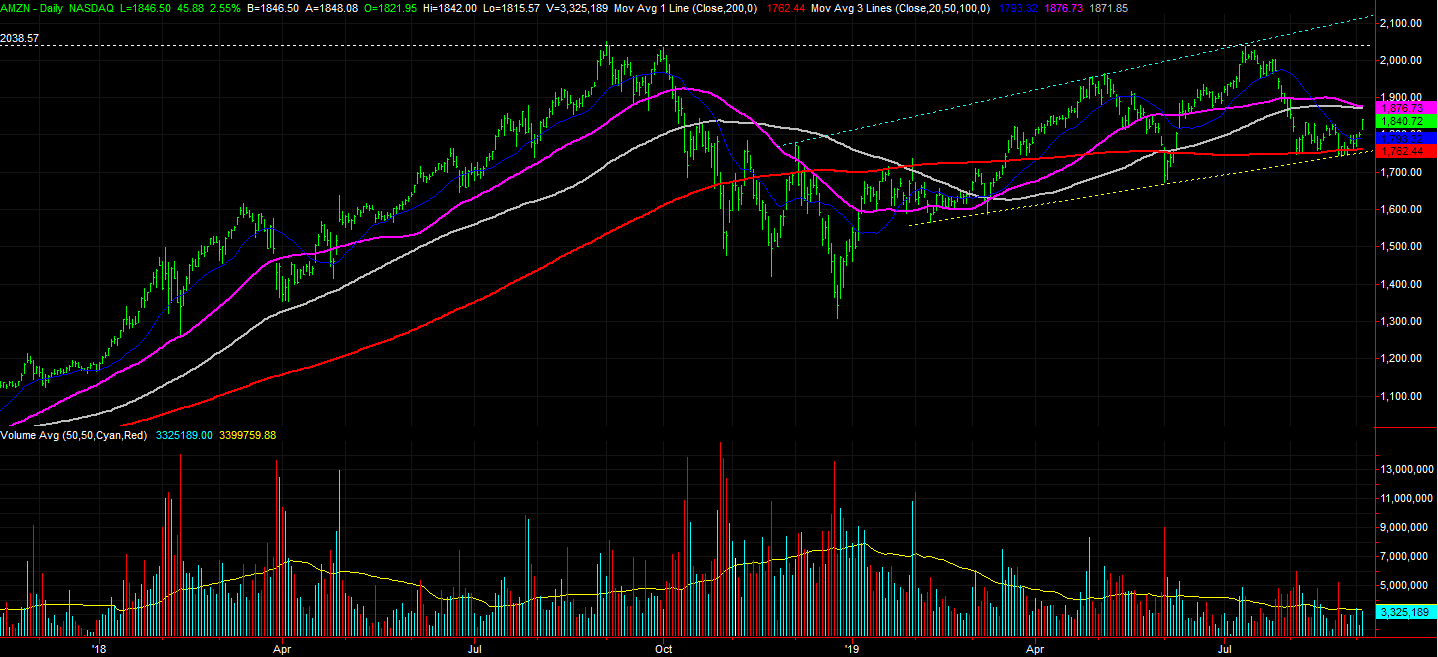
There's still some work to be done if the recovery effort is to become real. Namely, AMZN stock needs to clear the 50-day (purple) and 100-day (gray) moving average lines, both of which have the potential to act as resistance, and the former of which broke below the latter on Thursday. They're moving in the wrong direction, and won't be easy to clear. There's also a lack of volume behind the present rebound effort.
It's a start though.
Should Amazon shares manage to push through that resistance forming around 1876, there's room for a move all the way up to somewhere around 2120. That's where the upper edge of the established trading range will be by the time AMZN could test it, depending on how quickly the breakout moves ... if it moves. That ceiling is marked with a light blue line.
Also take note of the possibility that horizontal resistance could be found around 2038, where Amazon shares topped out in July as well as in September and October of last year.
If you'd like to get more out of the market by focusing on a smaller but more potent universe of stocks, the BigTrends FANG Options Trader advisory is for you. Not only does this service apply the specific nuances of the world's most traded biggest movers, it uses options to leverage those moves into even bigger gains. Go here to learn more.