There's Nowhere To Hide From the Market's Carnage... Except Here

Ouch. Stocks clearly took a dive last week, rekindling a selloff that actually got started in early September. The stage was set for at least a rebound effort on Monday, but no dice - the market logged another loss, moving to multi-week lows in the process. Most of the indices also broke below the 100-day moving average lines we mentioned in this weekend's Weekly Market Outlook were the most important remaining support levels.
In other words, it's bad. The selling is now in a situation where it could take on a life of its own, creating an environment where the bearish tide takes all stocks out to sea with it.
Except, not all stocks are actually being taken out to sea.
It's pretty common for traders to conflate "the market" and the S&P 500. On an even less formal basis, when traders talk about the market's health they're actually talking about popular growth stocks. Big mistake. While all stocks can and do move as a herd some of the time, other times, they're not all in the same boat. Small caps and mid caps can do their own thing. Value stocks and growth stocks are also not inherently tethered. That matters a lot -- probably -- right now.
Take a look at the performance comparison chart of the major style and market cap groups below. Large caps have been in a slump, and large cap growth stocks in particular. Not every grouping is losing ground though. Small cap value and mid cap value stocks are not only holding up, they're making forward progress in an otherwise challenging environment.
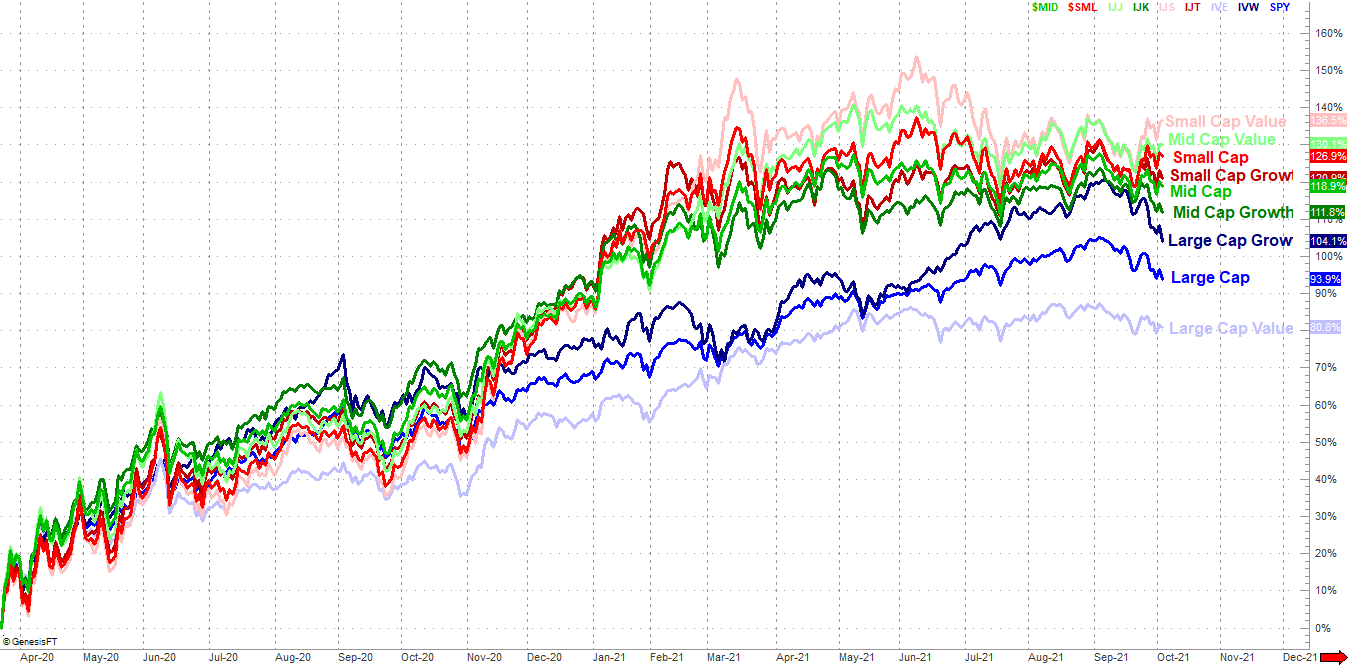
It's not a complicated explanation. Traders are migrating into names that are likely to be less impacted by a major market meltdown... probably. We have to assume this dynamic will remain in place until it's clear we can't any longer.
Small cap value stocks as measured by the iShares S&P 600 Value ETF (IJS) are also clearly in better technical condition than other groupings. With Monday's modest gain these names closed above their 100-day moving average line. It's now above all of its moving average lines, in fact... something that can't be said of any other group. In fact, it looks like IJS is finding support at the 50-day moving average line (purple), and knocking on the door of a break above technical resistance right around $104.00 (red, dashed).
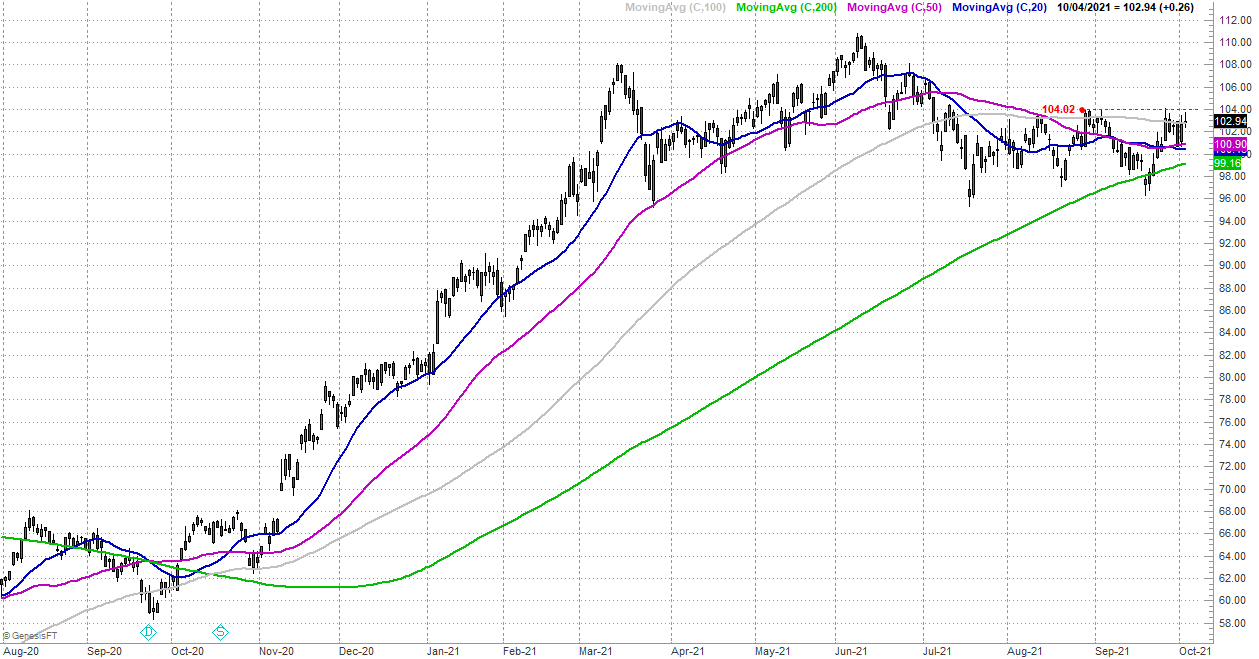
Is it enough to make a big bet? Not quite, and not just because this particular ETF really needs to clear the $104 mark to be as bullish as it could possibly be. If things go from bad to worse for the "the market" we typically interchange with the S&P 500, the tide could still up-end small and mid cap stocks of all ilks.
Still, it's a detail worth noting. It can't hurt to diversify long and short trades here, nor can it hurt to diversify away from the market's most watched and most traded stocks.