Weekly Market Outlook - The Bulls Dodge a Bullet, But Can They Do It Again?

Despite the weak start, the bulls quickly regrouped beginning on Monday afternoon, quelling the downtrend that tried to get going two weeks ago. Don't get too excited just yet, however. The S&P 500 bumped into a ceiling that the bulls desperately needed to clear, and the NASDAQ Composite failed to move to a new high. In fact, the NASDAQ suspiciously only tested its prior peak before is started to weaken. This week's early action is going to be very telling.
We'll look at it in detail below. First though, let's recap and preview some of the more important economic news.
Economic Data
Last week was a big week for consumer sentiment data. We heard the Conference Boards' measure on Tuesday, and we got the third/last score for the Michigan Sentiment Index on Friday. The former jumped to a multi-year high of 125.6, while the latter was up just a hair from February. This is an important undertow for the economy, though one can't help but wonder if last week's surge in confidence also represents an ultimate peak in sentiment that coincides with a market peak.
Consumer Sentiment Charts
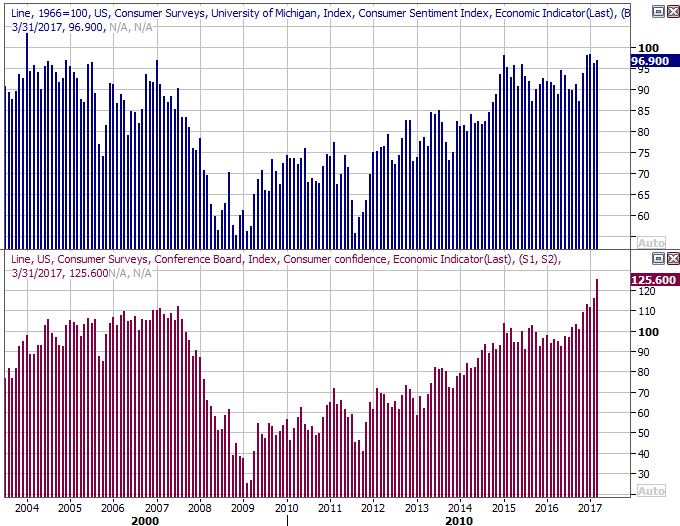
Source: Thomson Reuters
Last week's pleasant surprise was the third and final reading on Q4's GDP growth rate. It was revised upward, slightly, to 2.1%. That's still not 'great' compared to the recent past, but it offers some much-needed promise.
GDP Growth Charts
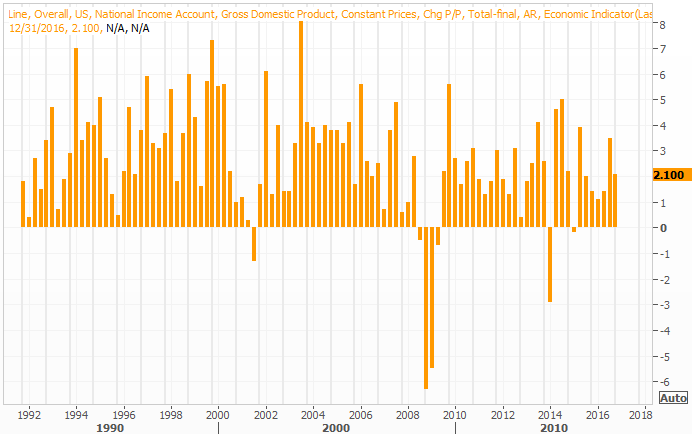
Source: Thomson Reuters
Everything else is on the grid.
Economic Calendar
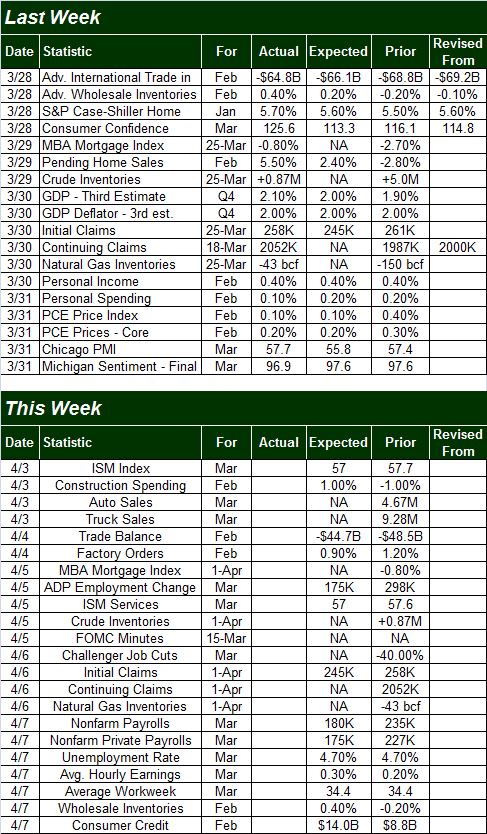
Source: Briefing.com
This week's biggie is going to be Friday's unemployment/employment report for March. It's been about as good as one could expect on the unemployment front -- the unemployment rate of 4.7% is considered "full employment" by most economists. On the other hand, while the previous month's job-growth figure of 235,000 new positions wasn't a pleasant surprise, the bigger trend there is still lackluster; we need to see 400,000 new jobs per month for the economy to get truly hot. The pros don't expect any impressive progress for last month.
Unemployment Rate and Payroll Growth Charts
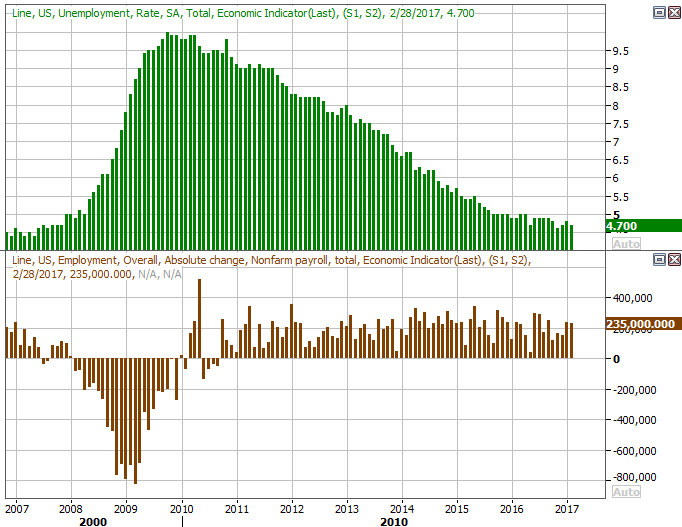
Source: Thomson Reuters
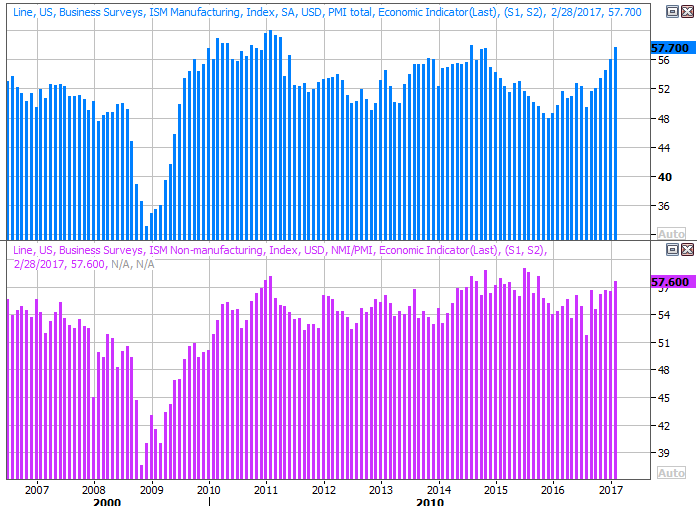
Also this week we'll hear about the ISM readings for last month... services and manufacturing. Both are projected to peel back a bit, but even with a lull they're still both going to be above the critical 50 mark.
ISM Indices Charts
Source: Thomson Reuters
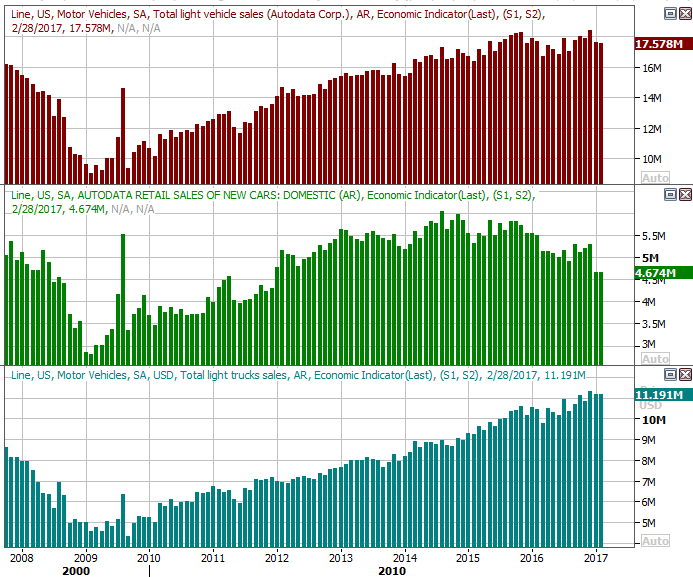
Also this week -- on Monday -- we'll hear last month's auto sales tallies. While truck sales continue to make progress, that again is being offset by the decline in car sales. The end result is a stagnant sales pace (though stagnant at 2016's levels isn't a bad thing).
Auto Sales Charts
Source: Thomson Reuters
The one thing you want to watch for with the automobile sales figures isn't the numbers themselves, but the discounts the manufacturers need to offer to induce those sales. Those price-breaks are getting very large, cutting into margins. The car market may not be quite as strong as it seems.
Index Analysis
Kudos to the bulls for rekindling the rally. After last Monday's rough open and move below the 50-day moving average line (purple) for the S&P 500, it would have been very easy for most traders to simply throw in the towel and let the selloff fully take hold. That didn't happen though. Instead, the S&P 500 bounced back... a little. It didn't bounce back enough though. As the daily chart of the S&P 500 below shows, once the former ceiling at 2371 was revisited -- and the 20-day moving average line was just barely cleared -- the buying effort tapered off. The index ended up closing back under the 20-day moving average line on Friday.
S&P 500 Daily Chart
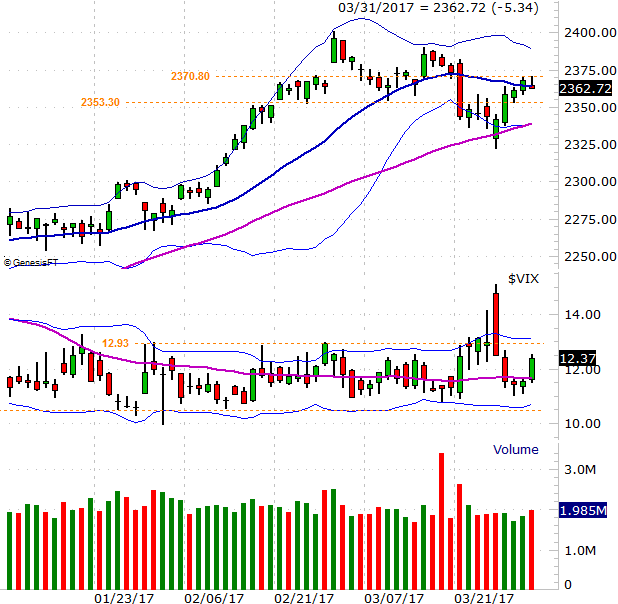
Chart created with TradeStation
The NASDAQ Composite faired a little better, though in the end didn't get over its key hump either. The former high/peak at 5930 ended up acting as a ceiling again on Friday, further slowing an already-slowing uptrend. It's no surprise that's near where the upper Bollinger band is either.
NASDAQ Composite Daily Chart
032617-sp500-daily)
Chart created with TradeStation
A view of the weekly chart of the NASDAQ Composite doesn't tell us anything new, but it does underscore the facts that (1) last week was almost a perfect bullish 'outside day' bar, and (2) the importance of the ceiling at 5930 became clear. This is essentially the fourth week in the past five that resistance has come into play. With a five-week buildup period in tow, the next bullish thrust may well break that resistance and unleash five weeks worth of pent-up demand in one fell swoop.
Or, that ceiling may nag the bulls into submission. We just don't know yet. We'll just say if the NASDAQ breaks below last week's low of 5769.39, look out below. The bulls have to be tired of these whiffs, and may be close to giving up soon if progress isn't in the cards.
NASDAQ Composite Weekly Chart
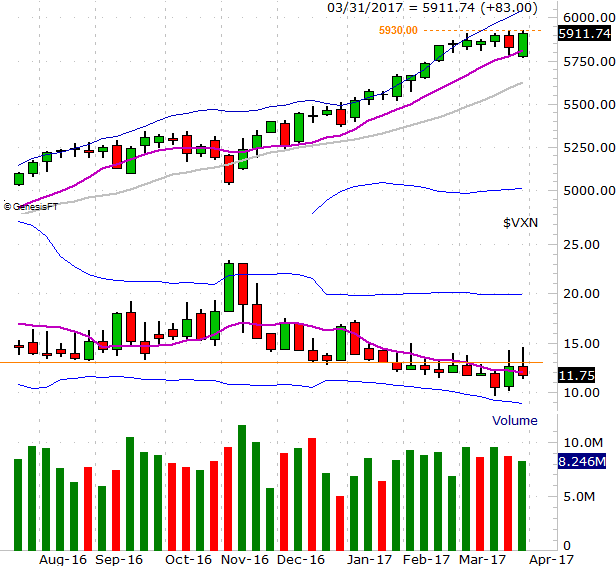
Chart created with TradeStation
The weekly chart of the S&P 500 looks a little less promising than the NASDAQ's chart does, mainly in that it made a lower low and a lower high, and is still well away from challenging its previous peaks. That's not even the biggest red flag that starts to wave on the weekly S&P 500 view though. The bigger concerns here are the sheer lack of volume behind ANY bullish effort we've seen of late, and the fact that the VIX is starting to trend higher. You can't see it on the weekly chart, but after last Monday's huge rise and subsequent pullback from the VIX, it started to perk up -- decisively -- on Friday even though the market wasn't back-pedaling in a big way. [The lack of bullish volume and fair amount of bearish volume is especially evident on the daily chart of the S&P 500.]
S&P 500 Weekly Chart
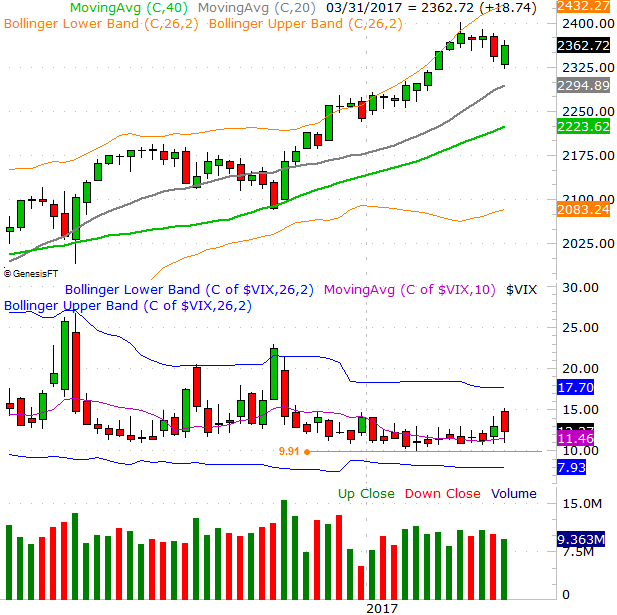
Chart created with TradeStation
To that end, the chart to watch here is the daily chart of the S&P 500. If the VIX breaks above its ceiling at 12.9 and the S&P 500 breaks below its floor at 2339, that should be the nail in the coffin. Conversely, bear in mind that the NASDAQ is fairly well-positioned for a breakout, and the S&P 500 could very easily follow that lead. Caution is advised before jumping on that bullish train though, should things take that shape. Such a breakout would be purely a sentiment-driven one... and not one that's well supported by fundamentals. Ergo, don't expect it to last long.
The market (still) desperately needs a correction. The bulls aren't opening that door though. Just be patient whatever you do next. The situation is one that's soon going to force the bulls and the bears to show their cards.