Weekly Market Outlook – Technical Resistance Dead Ahead. Just Don’t Sweat It Too Much Yet.

That’s five in a row. With last week’s 1.4% advance, the S&P 500 is up 7.0% for the five-week stretch. The market is just rolling.
On the other hand, with last week’s romp the index is now bumping into pretty-well-established technical resistance. It’s going to take something pretty special “umph” to keep things going. That’s even more the case in light of the fact that the S&P 500 is now up more than 22% from October’s bottom. That’s a lot for only a little less than four months.
Still, even a small stumble from here might be healthy, and wouldn’t necessarily have to stop the bigger-picture uptrend now underway.
We’ll dissect it all in a moment below. Before that’s let’s recap last week’s biggest economic announcements and take a look at what’s coming this week.
Economic Data Analysis
There was really only one item of interest posted last week. That’s the Institute of Supply Management’s update of its services index for January. It was good… even better than expected. The reading of 52.5 is up from December’s score of 50.5, topping expectations of 52.0. More important, that pushes the services index firmly above the critical 50 level that divides growth from contraction.
Still, it might be a bit too soon to say this data is truly in a new uptrend. The previous week’s update of the ISM Manufacturing Index, however, certainly underscores the argument that all things are getting generally better.
ISM Services and Manufacturing Index Charts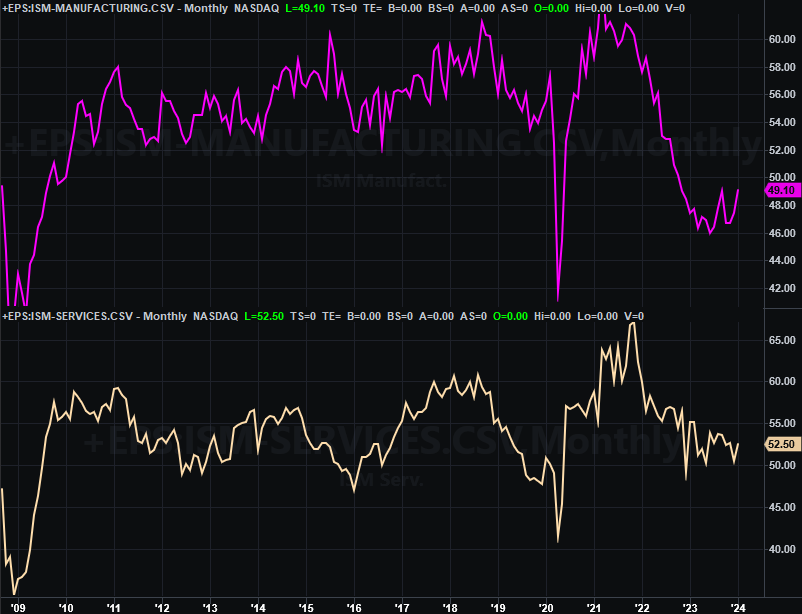
Source: Institute of Supply Management, TradeStation
Everything else is on the grid.
Economic Calendar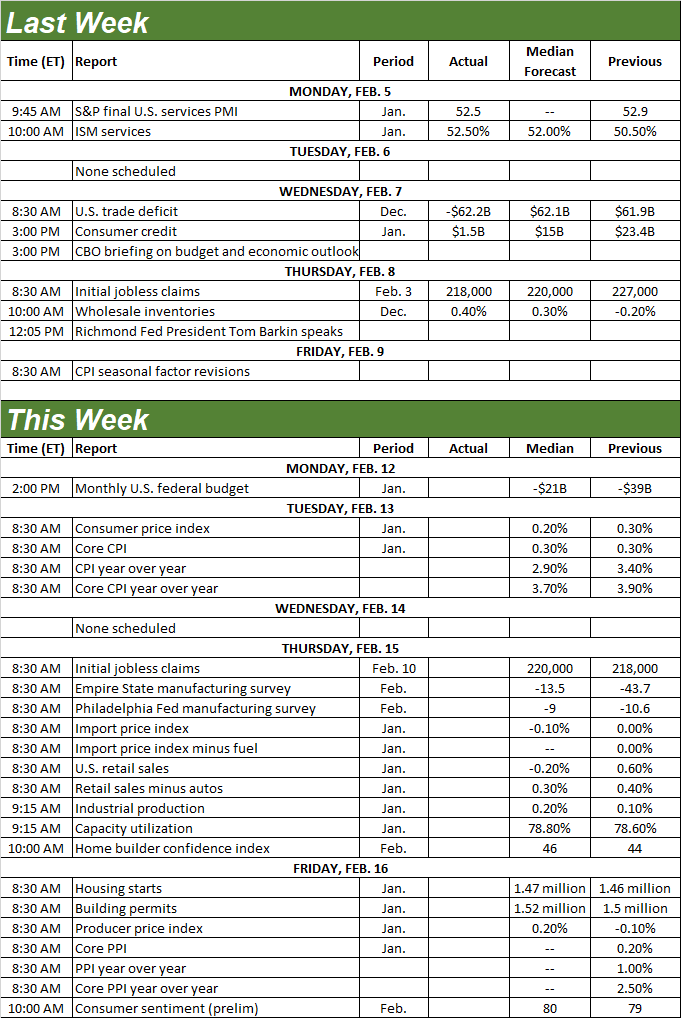
Source: Briefing.com
This week’s lineup will more than make up for last week’s lack of news.
Perhaps the biggest reports coming out this week are the looks at January’s inflation. Consumer inflation numbers are coming on Tuesday, with producers’ prices changes due on Friday. While well down from year-earlier levels, they’re still above the Fed’s target levels. They’ll likely continue cooling off -- a little -- though, giving the Federal Reserve some room to not be in a hurry to lower interest rates after all.
Inflation Rate (Annualized) Charts 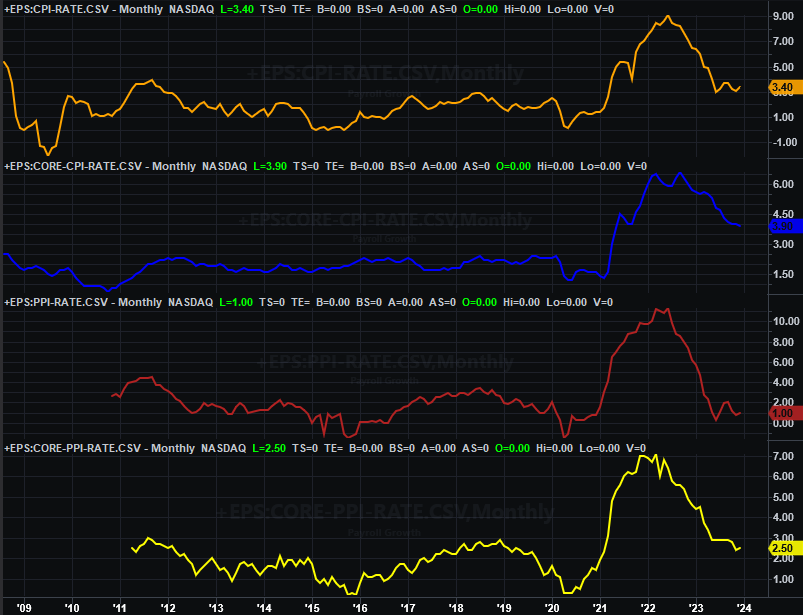
Source: Bureau of Labor Statistics, TradeStation
Last month’s retail sales will be posted on Thursday. December’s sales (mostly) grew, but economists aren’t so hopeful this trend persisted into the new year.
Retail Sales Charts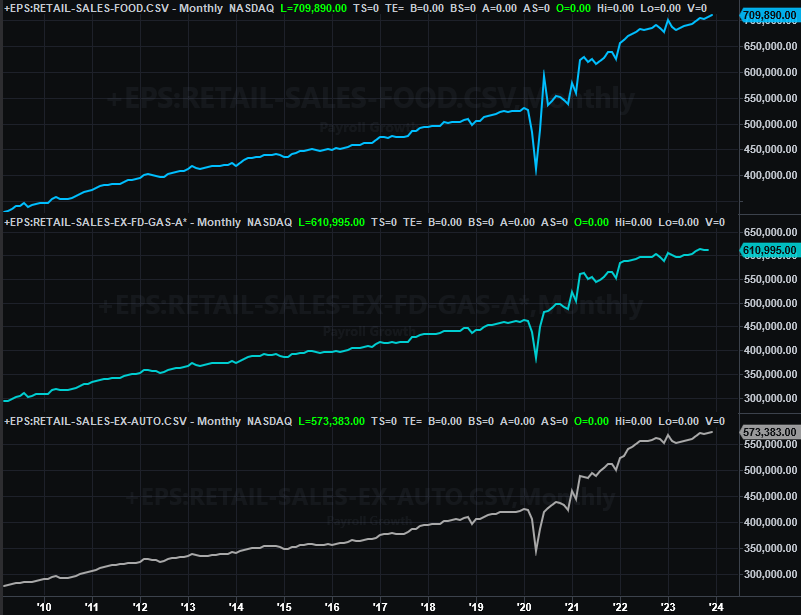
Source: Census Bureau, TradeStation
Also on Thursday look for last month’s capacity utilization and industrial productivity report from the Federal Reserve. Don’t dismiss the importance of these numbers. Although investors don’t give them too much credence, these figures demonstrated a very close correlation with corporate earnings and the stock market’s long-term direction. Their overall direction of late is a bit troubling, although analysts believe this data will follow through on December’s slight improvement with January’s numbers.
Capacity Utilization and Industrial Productivity Charts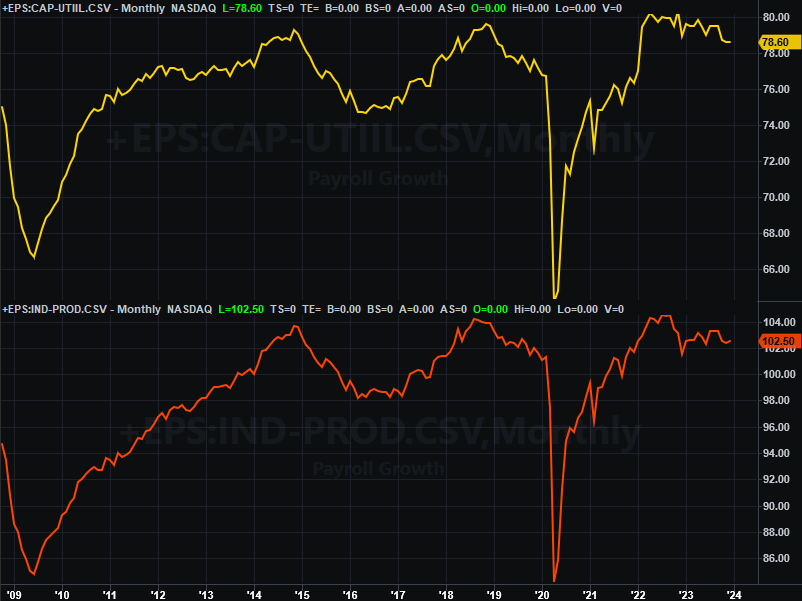
Source: Federal Reserve, TradeStation
Finally, on Friday we’ll hear January’s housing starts and building permits figures for last month. The numbers are projected to be slightly better than the prior month’s, but only a little. That will still leave them and weak levels. And that’s no small matter. Homebuilder confidence is high on recent declines in interest rates, and the housing shortage remains palpable. But, we’re not yet seeing a real rebound on this front.
Housing Starts and Building Permits Charts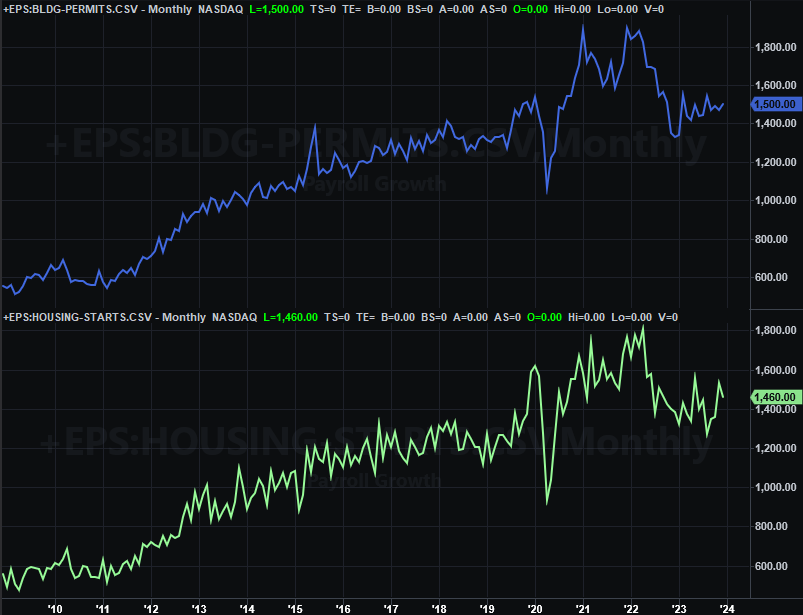
Source: Federal Reserve, TradeStation
Stock Market Index Analysis
This week begins with a zoomed-out look at the weekly chart of the S&P 500. From this vantage point the five-week rally becomes a sight to behold… particularly after the big runup from October’s low. The big noteworthy feature here, however, is the clear breakout thrust prompted by the cup-and-handle pattern that first started forming in early-2022; the brim line is at 4598. Once that brim line was breached, stocks didn’t look back.
S&P 500 Weekly Chart, with VIX and Volume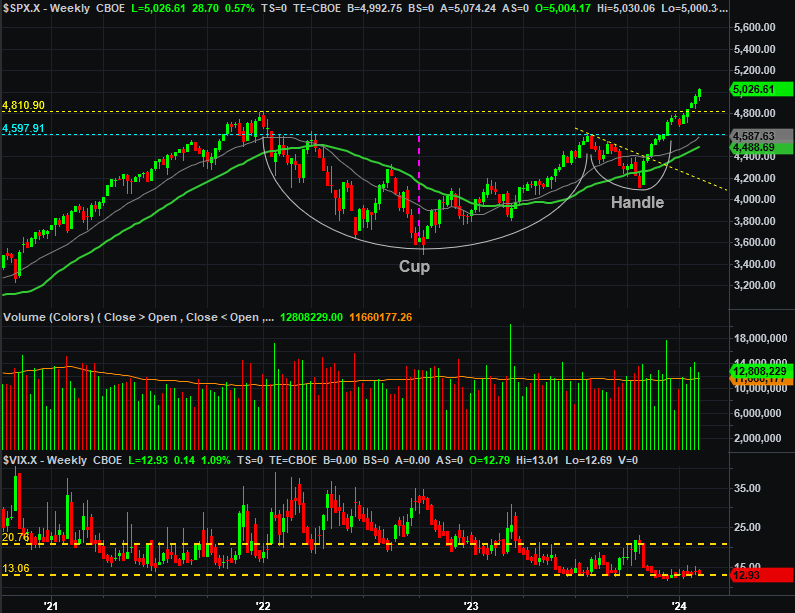
Source: TradeNavigator
The move begs one question though. That is, how far might the cup-and-handle breakout carry the index? The general rule of thumb is, the distance from the brim line to the bottom of the cup. In this case that’s just a little over 1,000 points. Assuming that’s in the cards this time around, the S&P 500 could rally to as high as 5,600 before running out of steam.
Just keep in mind that’s a rule meant to be broken. Also bear in mind that doesn’t mean the index has to get there in a straight line. In fact…
Take a look at the daily chart of the S&P 500. With last week’s push, it’s now testing a technical ceiling (orange, dashed) that connects all the key highs since early this year. It’s also testing another one that connects all the key peaks going back to October’s (aqua, dashed). If there was anywhere the buyers were going to run out of short-term steam, it’s here.
S&P 500 Daily Chart, with VIX and Volume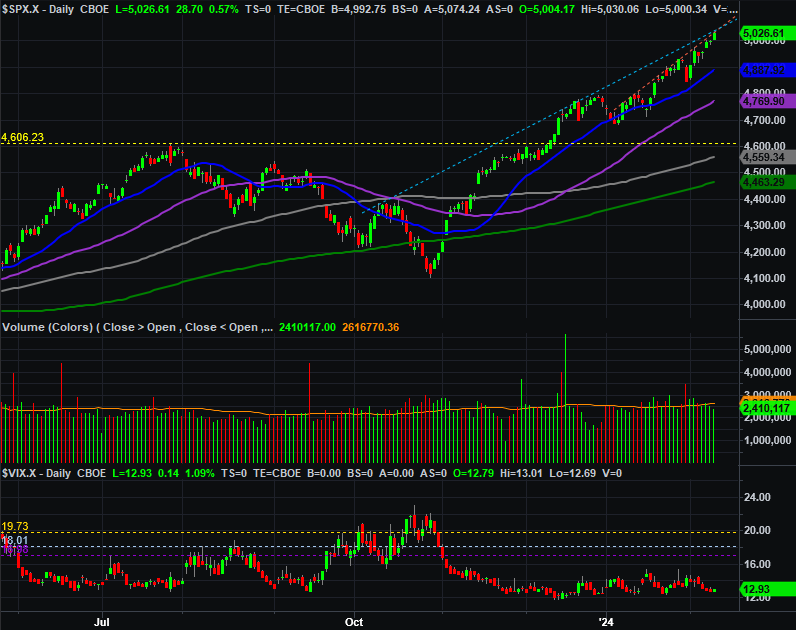
Source: TradeNavigator
That doesn’t have to mean the end of the bigger-picture rally, or the new bull market. As both charts above tell us, there’s all kinds of technical support below where any stumble could be stopped and reversed. The 20-day moving average line (blue) at 4,888 could be one, but the S&P 500 could slide all the way back to 4,600 without “falling too far.” As was noted, that’s where the cup-and-handle brim line is, which means it already has tendency to become a floor. That’s also where the 100-day moving average line (gray) could be, however, by the time the index is in a position to test it as a floor.
And the NASDAQ Composite is in a similar -- although not identical -- situation. It’s coming up on a big technical ceiling at 16,175 (yellow, dashed), where it topped out in late-2021. Traders may balk when they have to push the tech-led index into new-high territory.
NASDAQ Composite Weekly Chart, with VXN and Volume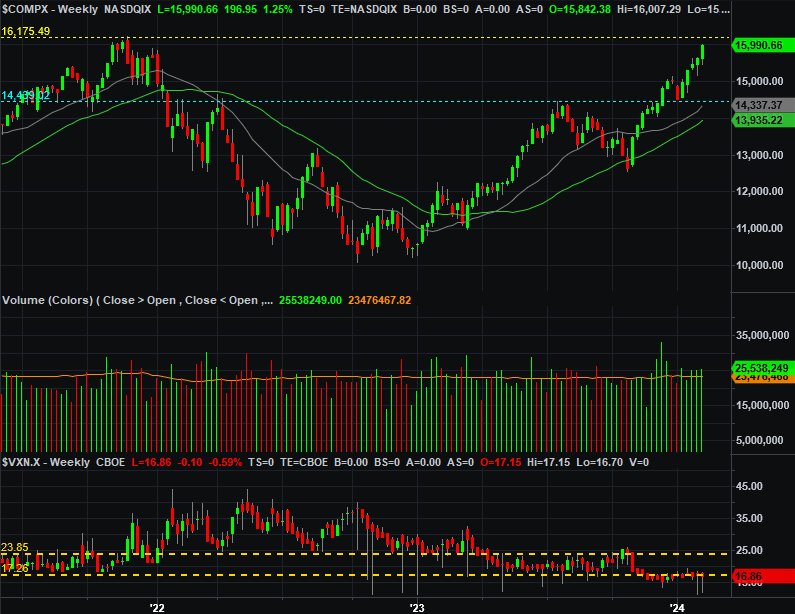
Source: TradeNavigator
Bottom line? Never say never. But, it’s going to be tough to tack on more gains straightaway from here. The technical ceilings now in play (or at least in view) make a pullback all the more likely. Just don’t panic of that’s what we see soon. A bit of a correction might actually be the best thing for this new bull market, actually. There’s lots of places any tumble could find a floor before building up too much bearish momentum.